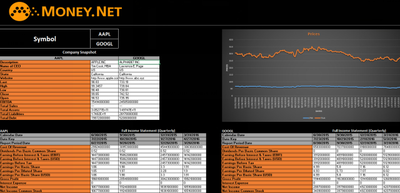
Single Stock Analysis
Getting Started with Money.Net Excel
![]()
![]()
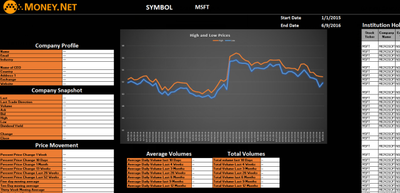
Single Stock Snapshot Analysis Toolkit.
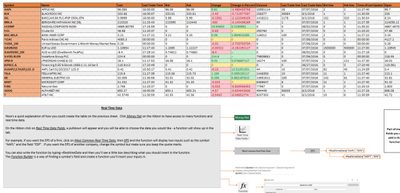
Default Money.Net Excel SpreadSheet for Accessing Realtime and Historical Data.
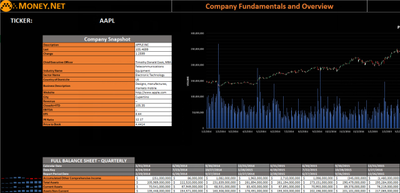
Company Fundamentals
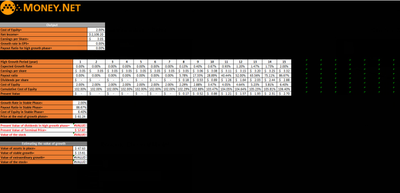
Dividend Discount Model
![]()
![]()
Examine and Analyze Corporate Fundamental Data for a Given Ticker.
Model the value of a stock price of a company based on the net present value of future cash flows
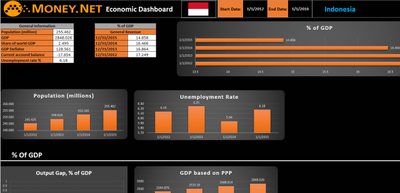
Economic Data Dashboard
Spreads Calculator
![]()
![]()
Pull Historical Economic Data on any Country.
Calculate the spread between two Money.Net assets and their Associated Metrics.
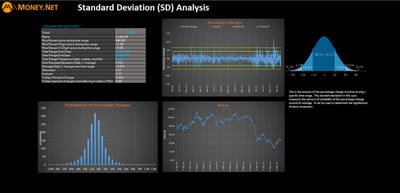
Standard Deviation Analysis
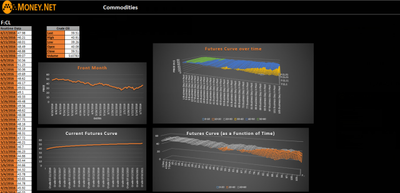
Futures Curve Historical
![]()
![]()
Analyze the percentage change of prices during a specific time range.
Chart the futures curve as a function of time.
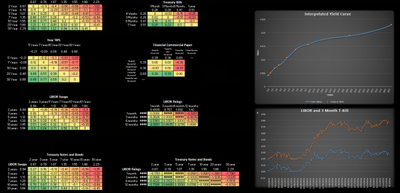
Common Interest Rates
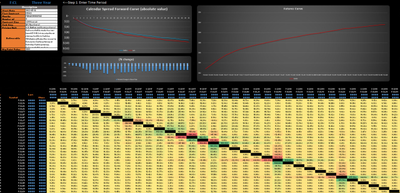
Calendar Spread
![]()
![]()
Analyze common interest rates and use Money.Net to generate an interpolated yield curve.
Analyze the futures spread forward curve.