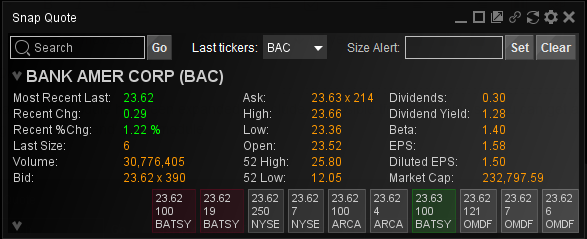
Snap Quote - Time and Sales Ticks and Alerts (v4.56)
See it Quicker.
The Snap Quote module has been expanded to include collapsible time and sales so you can get a quick view of the last trades without opening the full Time and Sales module. You can also set size alerts to know first when a trade of particular volume occurs.
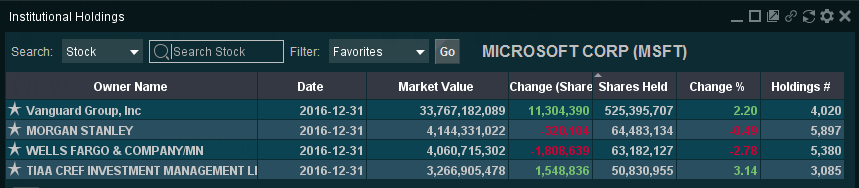
Institutional Holdings - Favorites (v4.56)
How many and where?
Now you can star your favorite institutions and filter by them. Need to find out how much AAPL Morgan Stanley is holding? Now you can do it quickly.
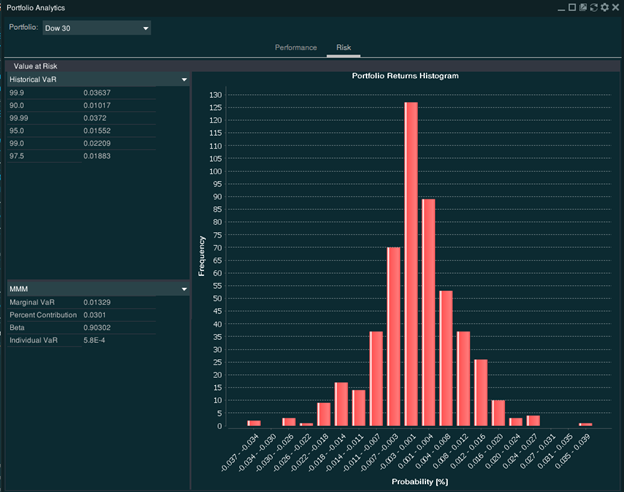
Portfolio Analytics - Optimization and Custom Benchmarks (v4.56)
Make it better.
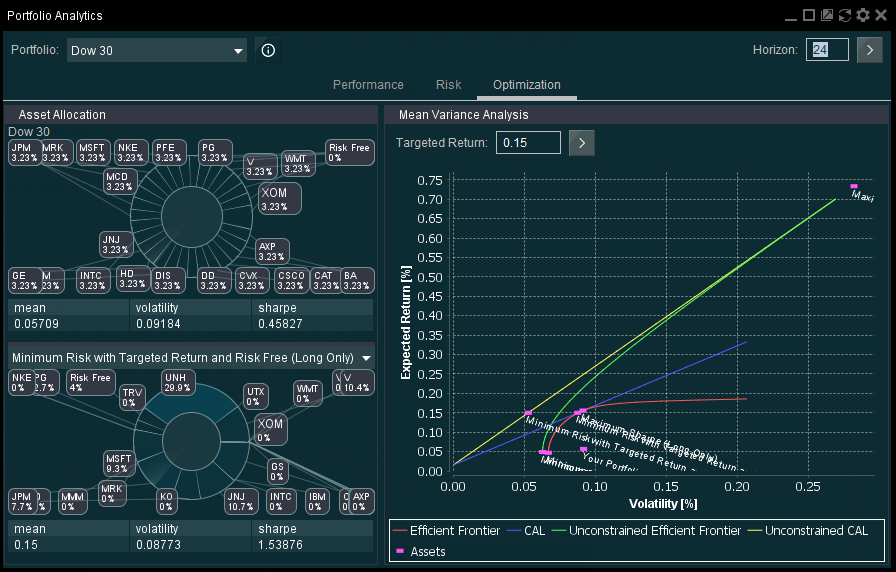
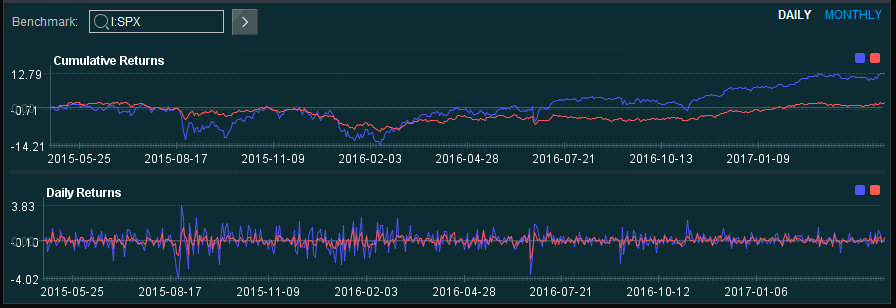
You can now also change your benchmark to any valid Money.Net symbol or Index.
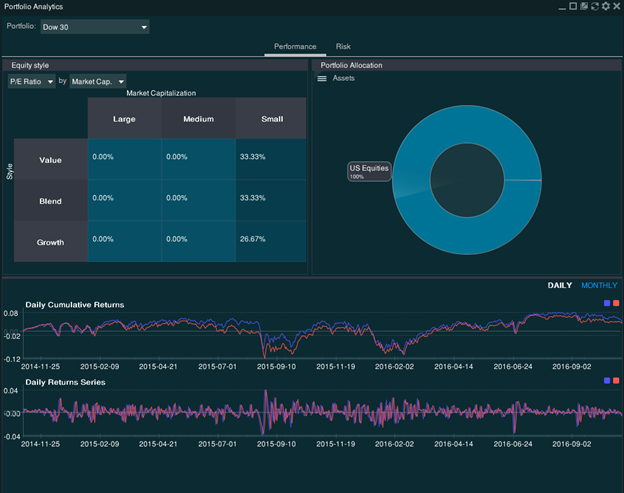
Portfolio Analytics Module (v4.55)
Analyze your performance attribution and risk of a multi-asset class portfolio
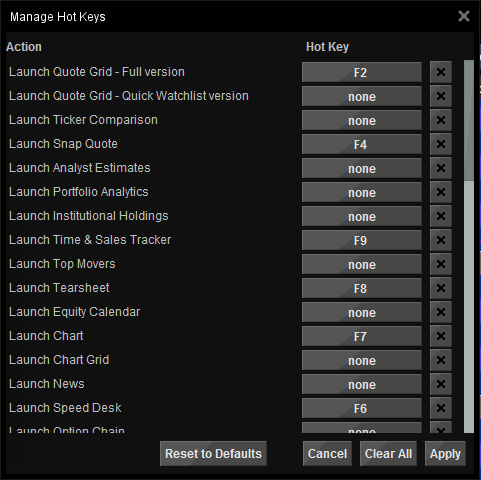
Need your favorite module even faster? Do it.
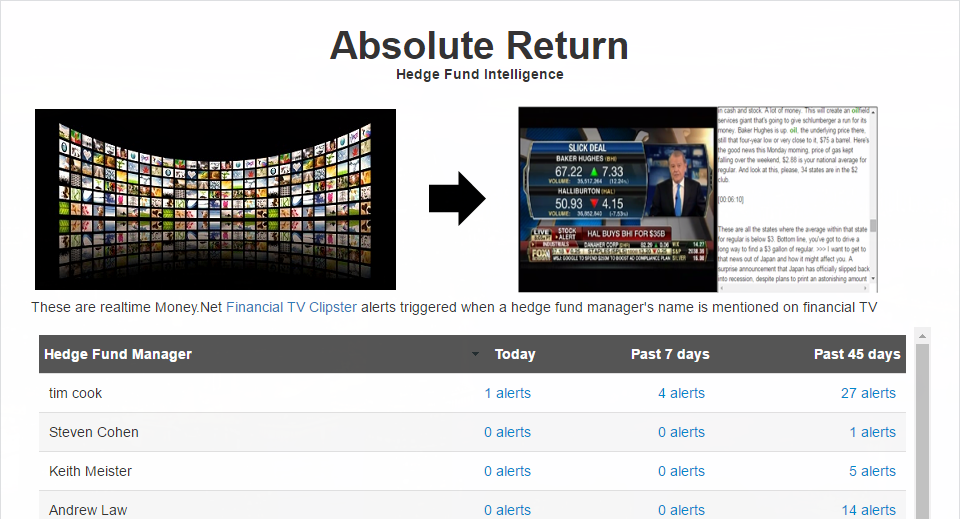
Hedge Fund Intelligence (v4.55)
TV Clipster alerts when a hedge fund manager is mentioned in the news
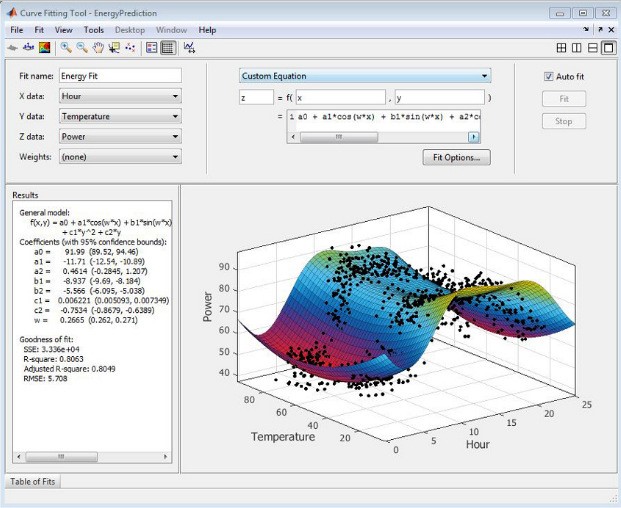
Integration with MATLAB (v4.53)
![]()
Summary: Analyze complex market data and news quickly with Money.Net data through MATLAB.
Who? Data analysts and developers. MATLAB is the easiest and most productive software environment for market data analysis by financial engineers, data scientists, financial analysts, quants, strategists, risk managers, students, and academic researchers. Banks, hedge funds, asset managers, students and academics all use MATLAB.
What? Mathematical analysis software. MATLAB (matrix laboratory) is a programming language used to mathematically analyse large amounts of data, including market data, developed by the firm MathWorks, Inc. Money.Net is a market data firm providing realtime and historical market prices, reference fundamentals like economic data, financial statements, supply and demand numbers, as well as breaking news.
Where?
Step 1: One must first be a regular monthly subscription customer of Money.Net and obtain a standard Money.Net login.
Step 2: One must then purchase a copy of MATLAB from MathWorks.
How is this better than Bloomberg? Unlike Bloomberg and other old clunky legacy expensive applications, no special add in is required to use Money.Net data in MATLAB. Money.Net just works natively with MATLAB, which is a huge benefit versus other market data vendors requiring a clunky add in to be installed and maintained.
Why? Speed and productivity. MATLAB is designed for data scientists that need to interact quickly with market data in a mathematical manner. The software allows easy 2D and 3D visualization of data, quick investigation of trade ideas using MATLAB’s extensive set of built-in math functions, and allows one to perform common mathematical tasks without having to program. The software allows for rapid curve fitting, data classification, signal analysis, and many other specific financial data tasks.
How? Learn how to use Money.Net market information through MATLAB here.
Cost: Money.Net monthly/annual subscription PLUS a purchased copy of MATLAB.
Screenshot:
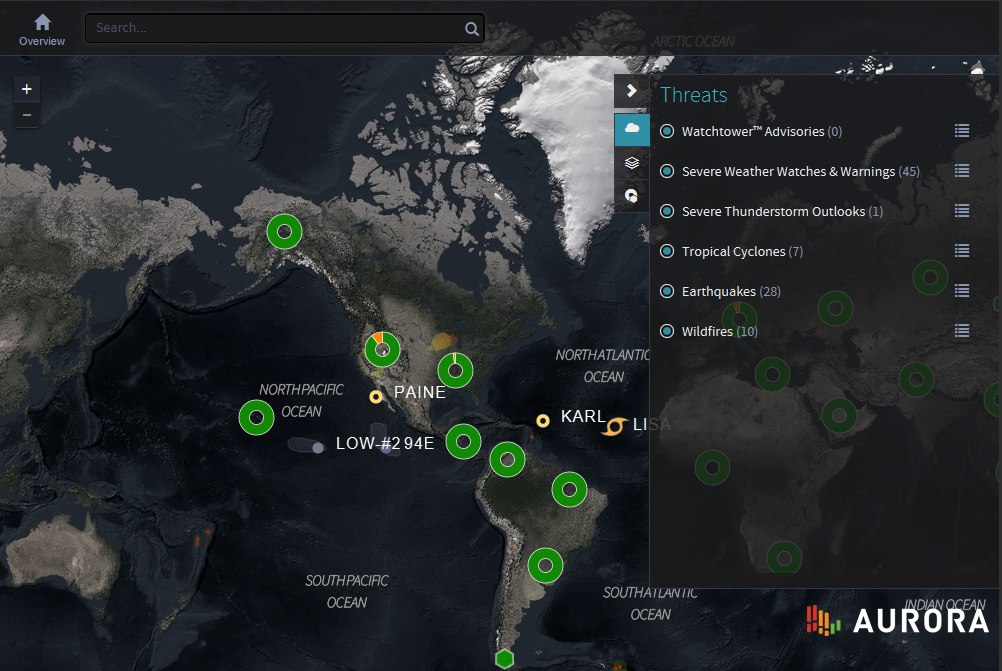
Aurora Maps by Riskpulse Module (v4.53)
See global weather alerts and patterns near refineries and other assets
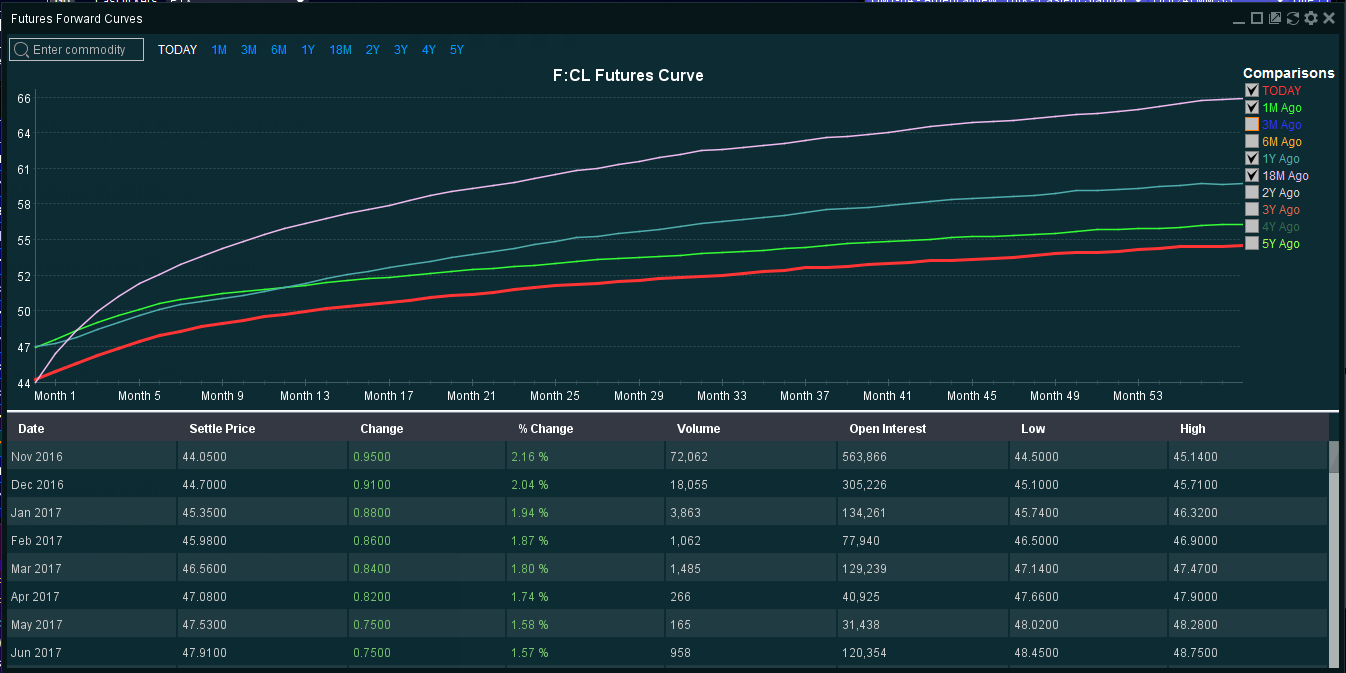
Futures Forward Curves Module (v4.53)
View futures curves
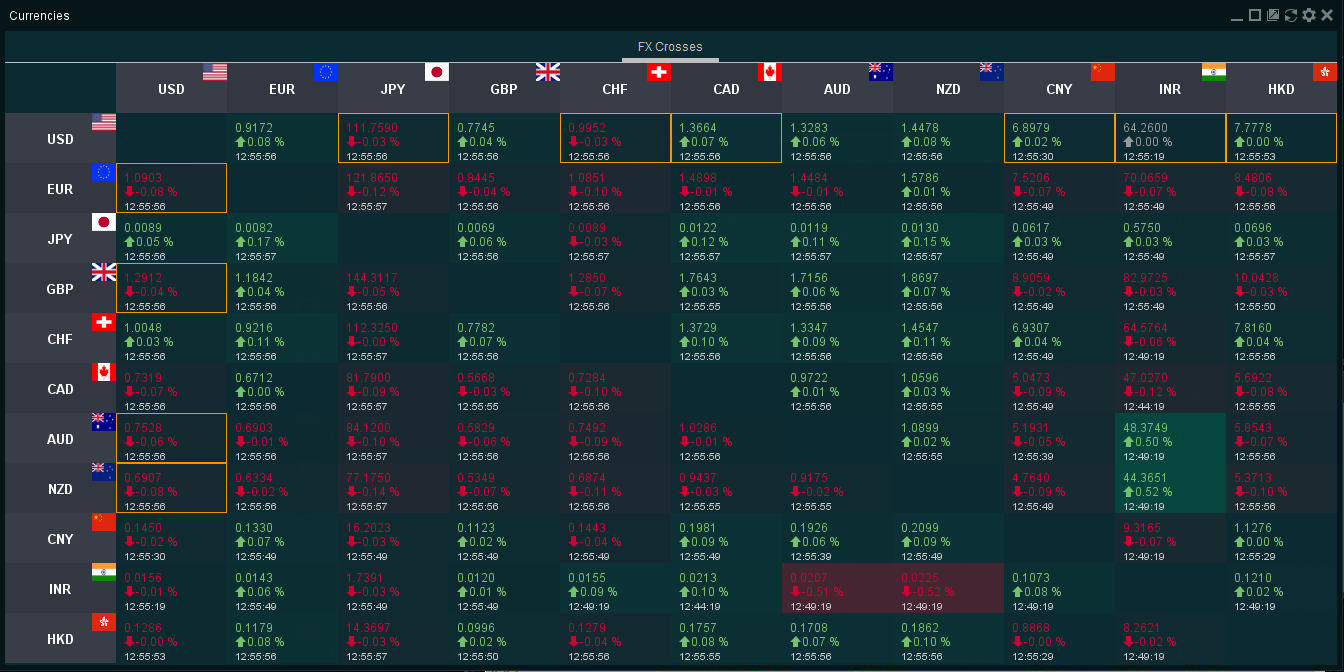
Currencies Module (v 4.52)
Watch FX Crosses update in real time
Other Additions
- "Day Moving Average" Overlay added to Charts
- "INR" added to Currencies module FX crosses
- Chart performance enhancements
- Chat connectivity improvement
- Minor bug fixes