| Table of Contents | ||
|---|---|---|
|
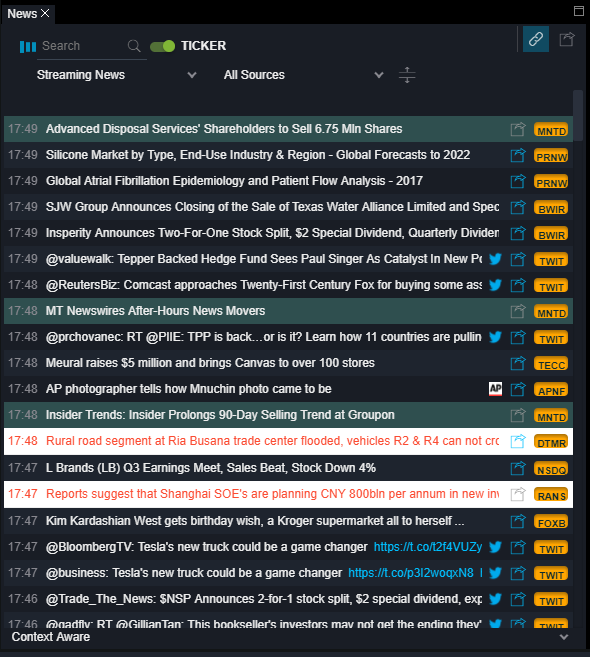
The News component is our proprietary, algorithm and hand-curated stream of news services brought to you in real time. You can follow market movement, major global news, and sort by companies or search terms that you choose.
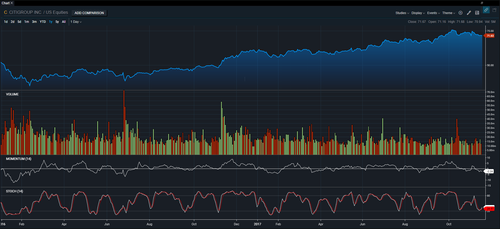
The Chart module is a new and improved, professional grade charting platform that is both intuitive and powerful! The charting package can provide live realtime ticks or 20 years of historical data with just the click of a button. It also includes a variety of tools such as:
- Over 70 Technical Study Indicators
- Corporate Events
Bar, Line, Area, Candle Graphs, and more
- Export to PNG
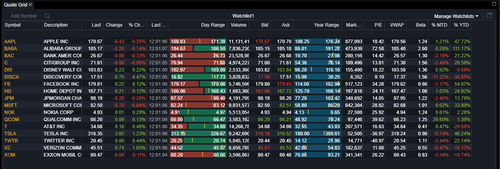
The Quote Grid allows you to maintain up to 25 watchlists to view streaming real time market data. In this component, you can sort, order, add/remove and arrange the data to your preference.
The Portfolio Monitor allows you to maintain up to 25 portfolios to view streaming real time market data and monitor your holdings and totals.
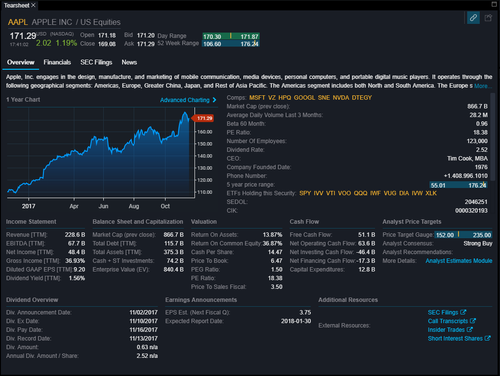
The Tearsheet is a one stop institutional grade summary snapshot. It is an efficient way to display a wide range of data such as:
- Realtime price data
- Company financials and fundamentals
- Historical charting
- Relevant news
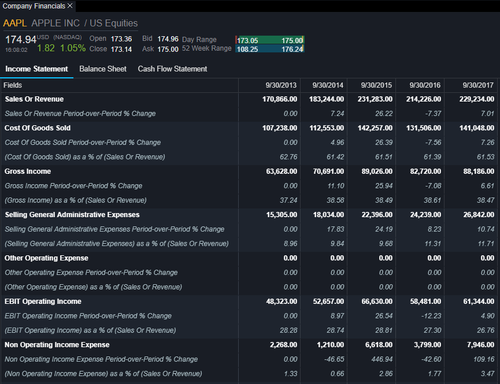
The Company Financials Module is an easy to digest representation of the Income Statement, Balance Sheet, and Cash Flow of publicly traded U.S. companies.
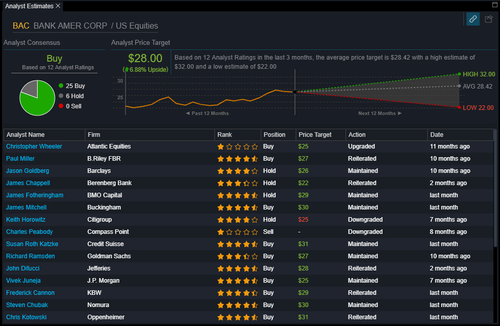
With Analyst Recommendations you can view price targets and consensus Buy/Sell recommendations from TipRanks™.
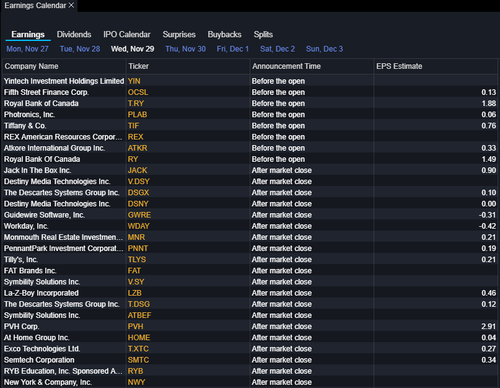
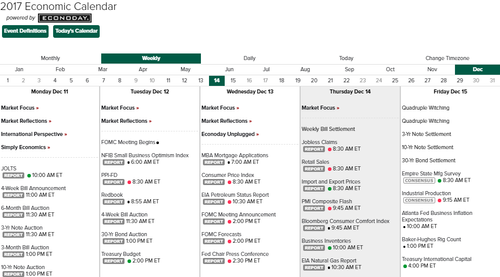
Economic Calendar is an overview of the week's events involving:
- Earnings
- Dividends
- IPO
- Surprises
- Buybacks
- Splits
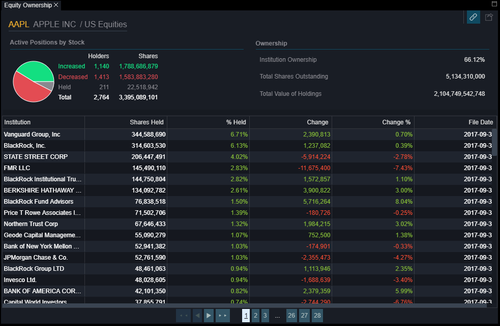
Equity Ownership allows you to view the institutional ownership of U.S. companies.
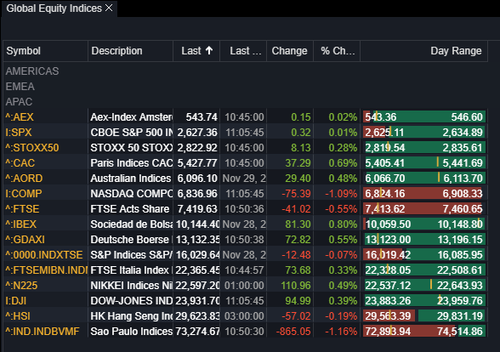
The Global Equity Indices component is an overview of some of the major indices in the U.S. and abroad.
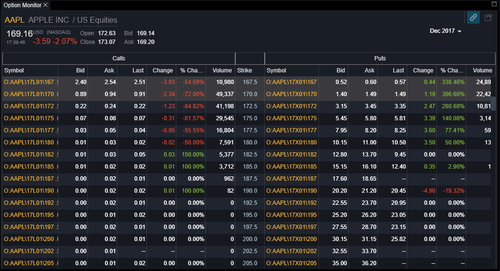
The Option Monitor allows you to pull the real time option data for U.S. equities (requires OPRA exchange permission from CBOE™).
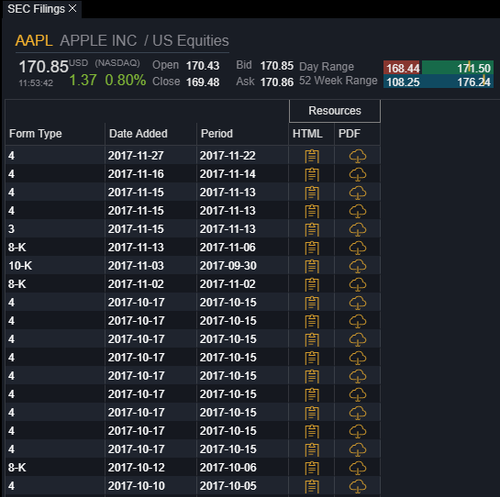
SEC Filings gives you quick access to HTML and PDF versions of public EDGAR filings for U.S. companies.
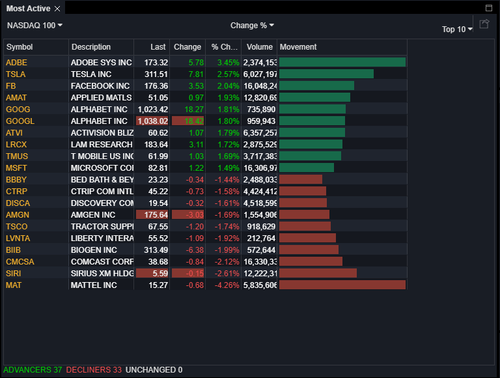
Most Active allows you to view the top 10,25, or 50 movers on the day in any of your watchlists or portfolios.
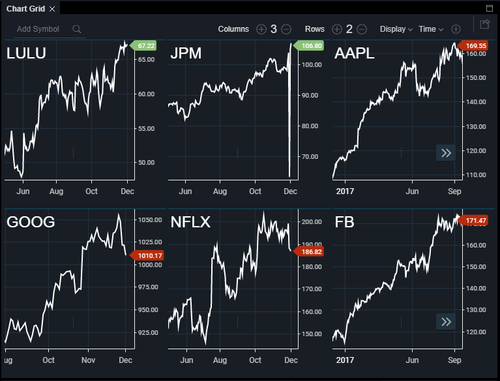
The chart grid is the best way to chart multiple assets quickly and simply without deploying multiple /wiki/spaces/techsupport/pages/37650457 components.
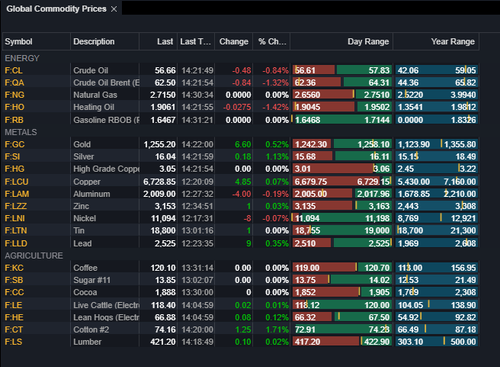
Global Commodity Prices
Global Commodity Prices gives you a quick overview of prices for major Energy, Metal, and Agricultural futures.
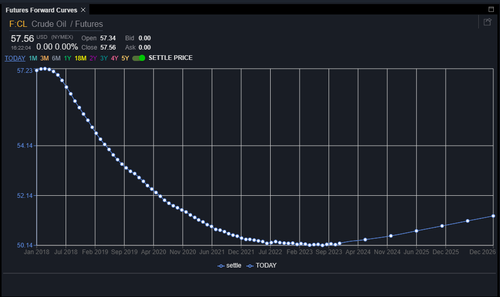
The Futures Forward Curve defines the prices at which a contract for future delivery or payment can be concluded today.