Need your favorite module even faster? Do it.
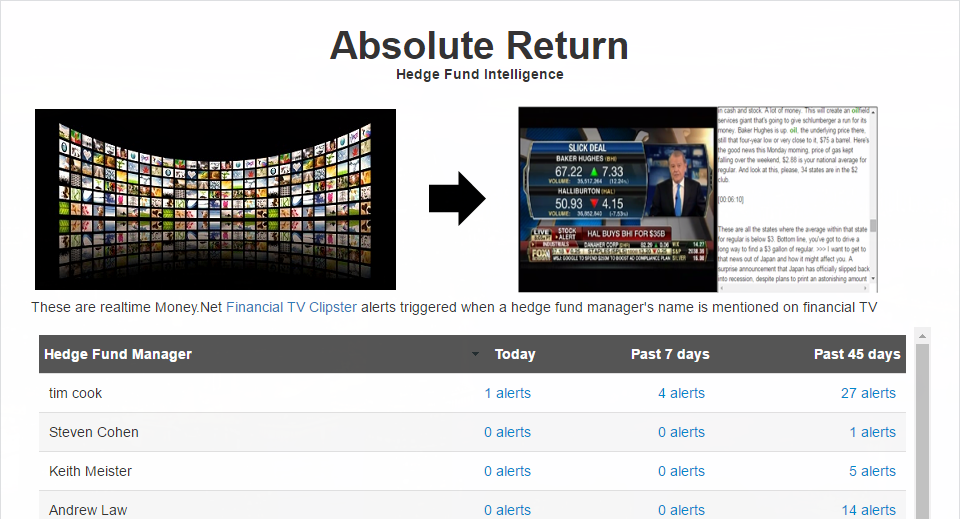
Hedge Fund Intelligence (v4.55)
TV Clipster alerts when a hedge fund manager is mentioned in the news
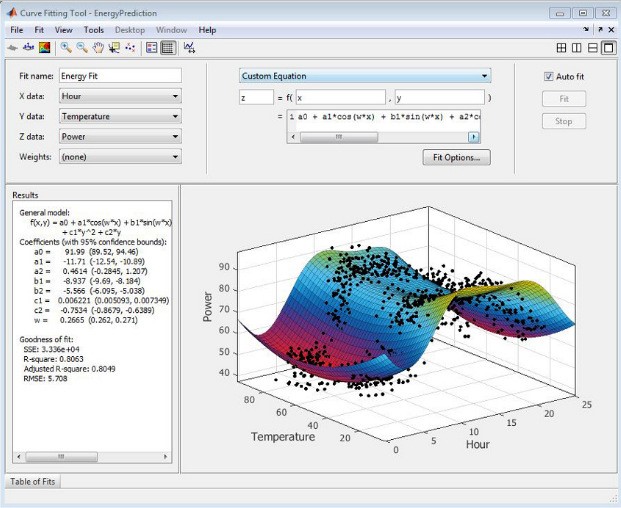
Integration with MATLAB (v4.53)
![]()
Summary: Analyze complex market data and news quickly with Money.Net data through MATLAB.
Who? Data analysts and developers. MATLAB is the easiest and most productive software environment for market data analysis by financial engineers, data scientists, financial analysts, quants, strategists, risk managers, students, and academic researchers. Banks, hedge funds, asset managers, students and academics all use MATLAB.
What? Mathematical analysis software. MATLAB (matrix laboratory) is a programming language used to mathematically analyse large amounts of data, including market data, developed by the firm MathWorks, Inc. Money.Net is a market data firm providing realtime and historical market prices, reference fundamentals like economic data, financial statements, supply and demand numbers, as well as breaking news.
Where?
Step 1: One must first be a regular monthly subscription customer of Money.Net and obtain a standard Money.Net login.
Step 2: One must then purchase a copy of MATLAB from MathWorks.
How is this better than Bloomberg? Unlike Bloomberg and other old clunky legacy expensive applications, no special add in is required to use Money.Net data in MATLAB. Money.Net just works natively with MATLAB, which is a huge benefit versus other market data vendors requiring a clunky add in to be installed and maintained.
Why? Speed and productivity. MATLAB is designed for data scientists that need to interact quickly with market data in a mathematical manner. The software allows easy 2D and 3D visualization of data, quick investigation of trade ideas using MATLAB’s extensive set of built-in math functions, and allows one to perform common mathematical tasks without having to program. The software allows for rapid curve fitting, data classification, signal analysis, and many other specific financial data tasks.
How? Learn how to use Money.Net market information through MATLAB here.
Cost: Money.Net monthly/annual subscription PLUS a purchased copy of MATLAB.
Screenshot:
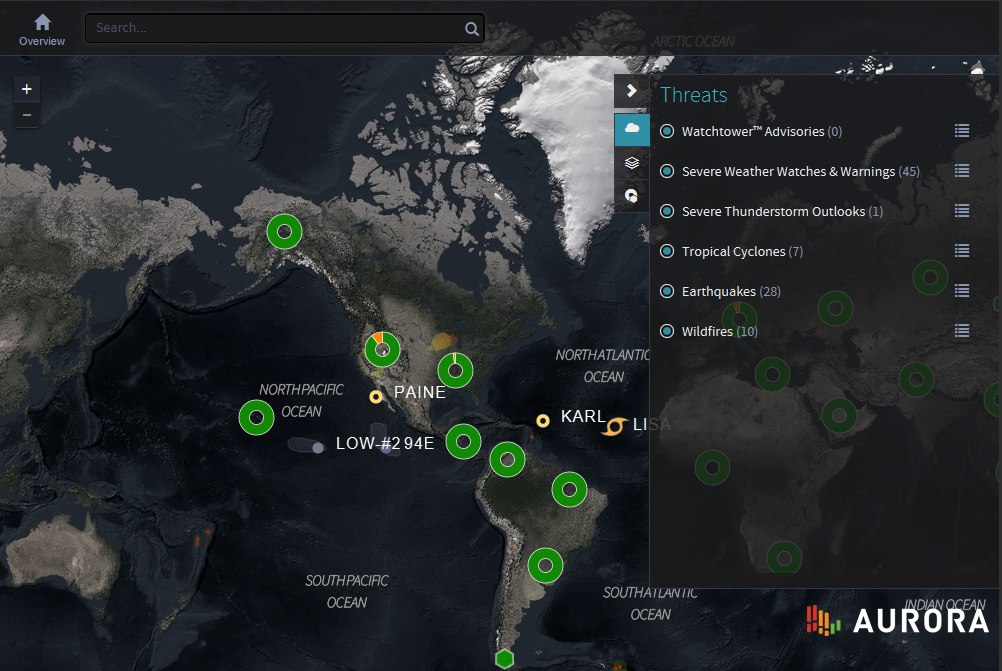
Aurora Maps by Riskpulse Module (v4.53)
See global weather alerts and patterns near refineries and other assets
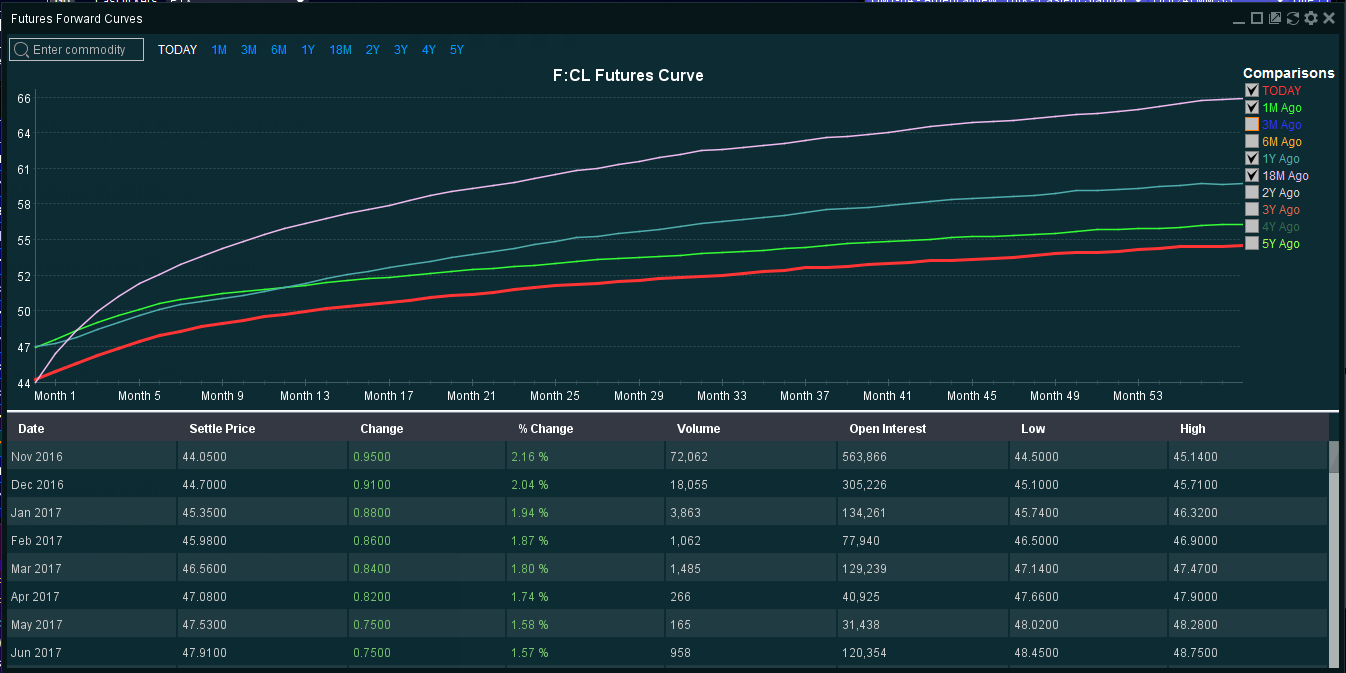
Futures Forward Curves Module (v4.53)
View futures curves
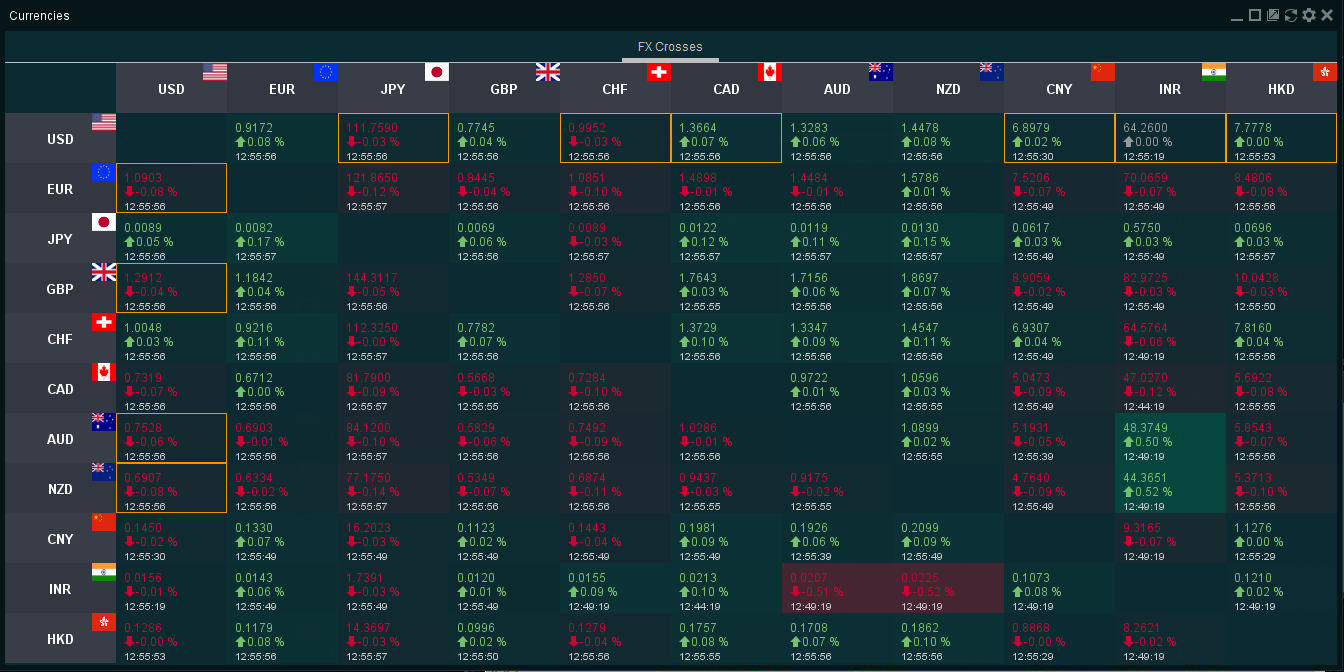
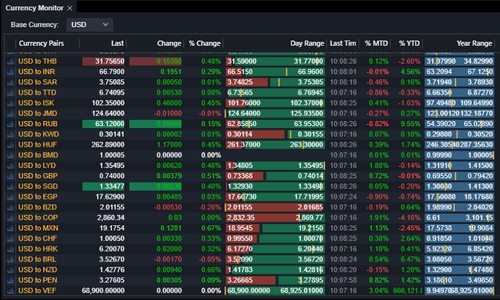
Currencies Module (v 4.52)
Watch FX Crosses update in real time
Other Additions
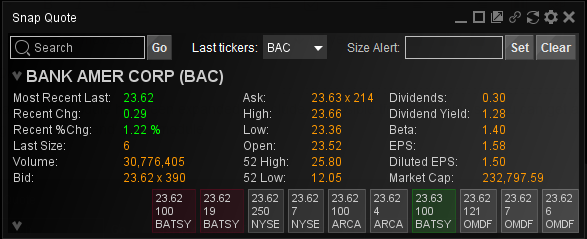
Snap Quote - Time and Sales Ticks and Alerts (v4.56)
See it Quicker.
The Snap Quote module has been expanded to include collapsible time and sales so you can get a quick view of the last trades without opening the full Time and Sales module. You can also set size alerts to know first when a trade of particular volume occurs.
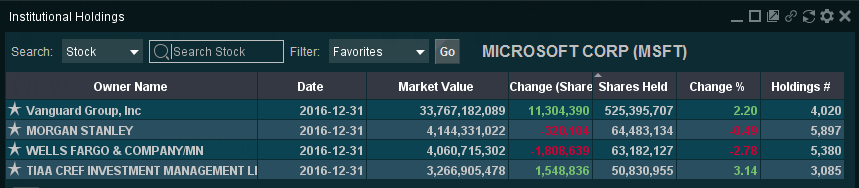
Institutional Holdings - Favorites (v4.56)
How many and where?
Now you can star your favorite institutions and filter by them. Need to find out how much AAPL Morgan Stanley is holding? Now you can do it quickly.
Portfolio Analytics - Optimization and Custom Benchmarks (v4.56)
Make it better.
The new Optimization section enables you to look at the current portfolio holdings, and re-balances based off of Markowitz mean-variance optimization techniques. It prints the efficient frontier, and produces the market portfolio with a given risk-free rate.
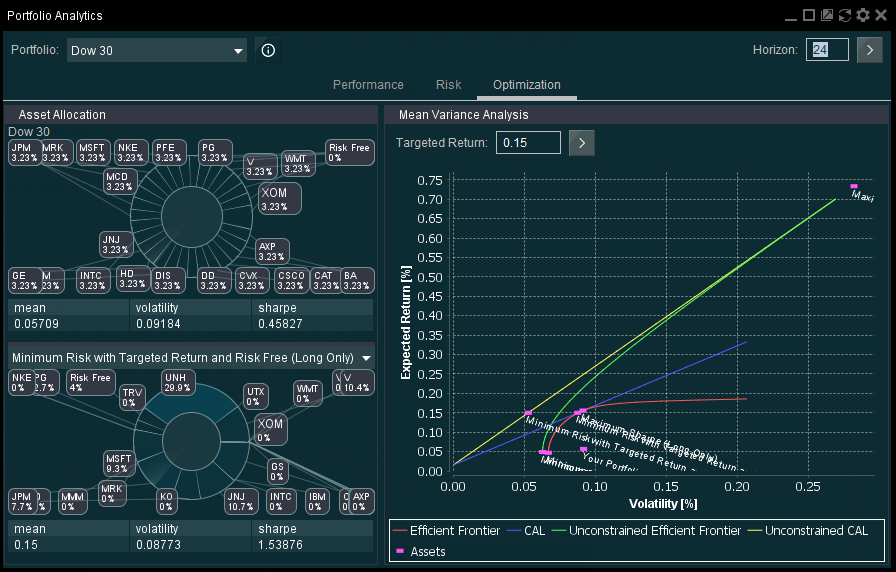
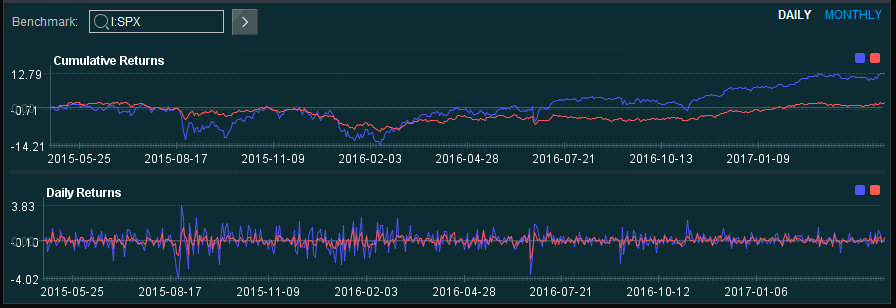
You can now also change your benchmark to any valid Money.Net symbol or Index.
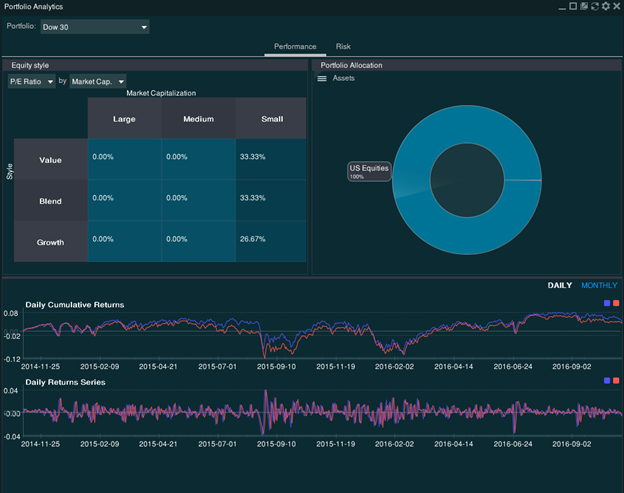
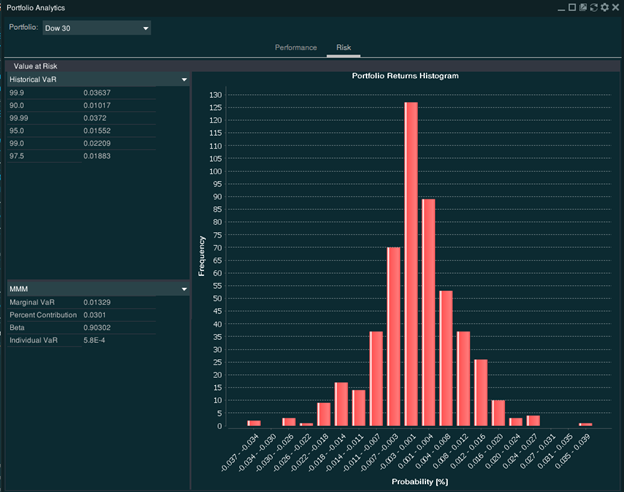
Portfolio Analytics Module (v4.55)
Analyze your performance attribution and risk of a multi-asset class portfolio
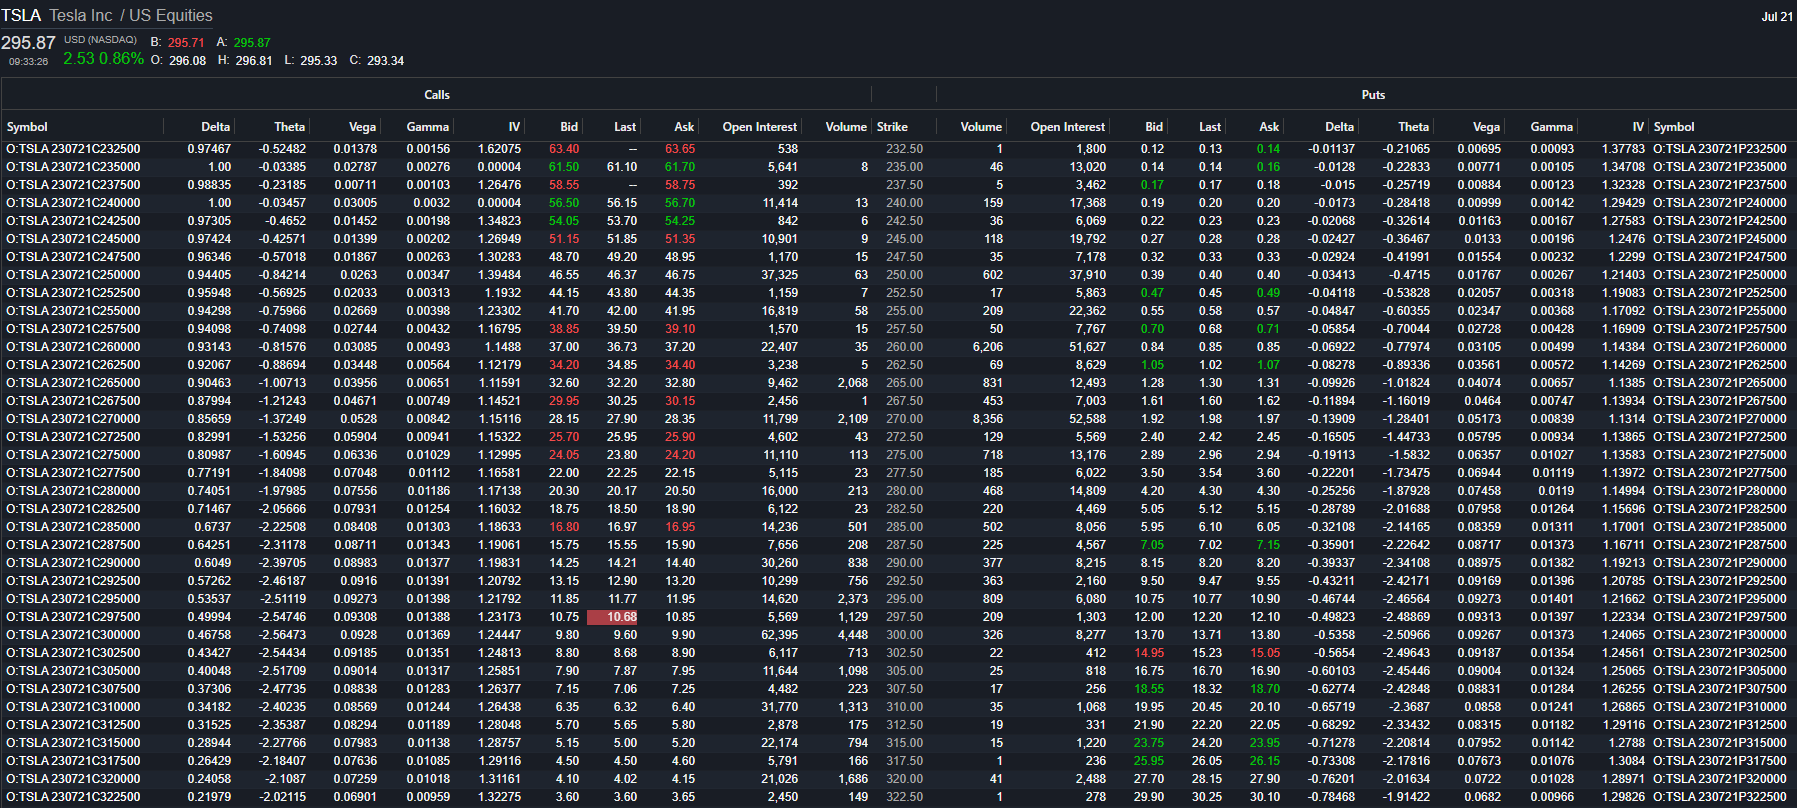
Option Greeks (1.8.8)
Greek on a Leash.
For options traders, managing risk is extremely important. That is why we have added Greeks (and Implied Volatility) to the Option Chain at no extra charge.
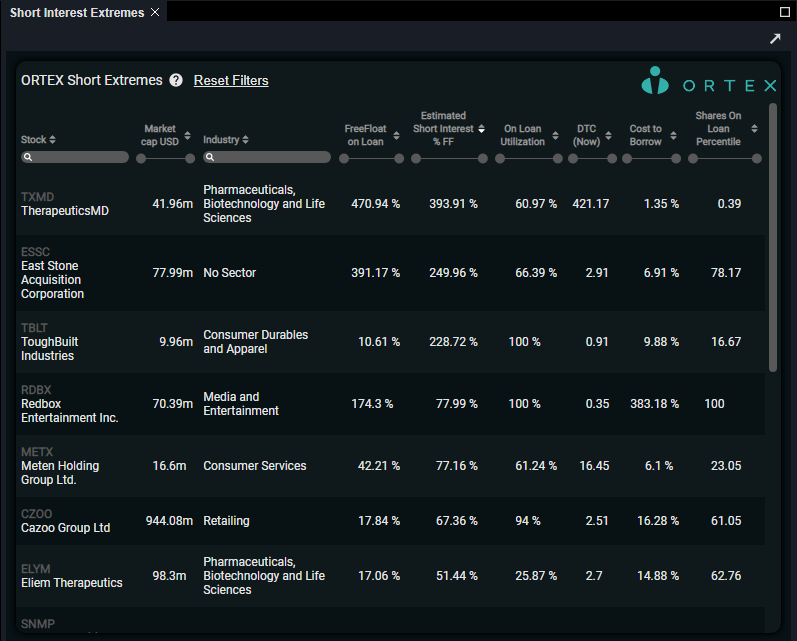
Short Interest Extremes (1.8.6)
Looking for a squeeze play? Short Interest Extremes is a specialized screener you can use to filter for stocks based on Short Interest %, Free Float, Cost to Borrow, and more.
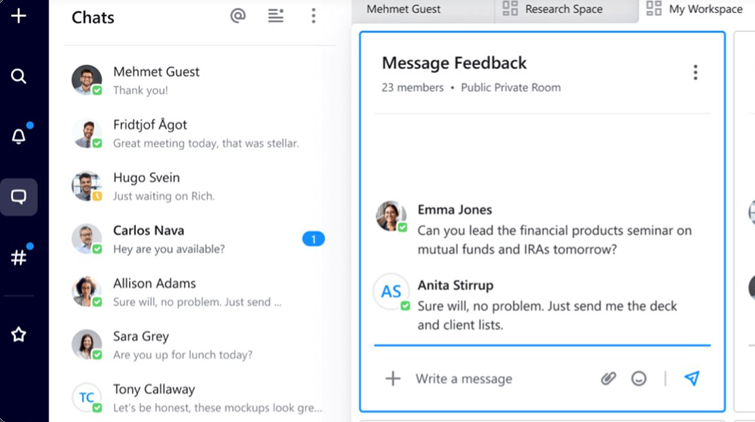
Scout Chat (1.8.3)
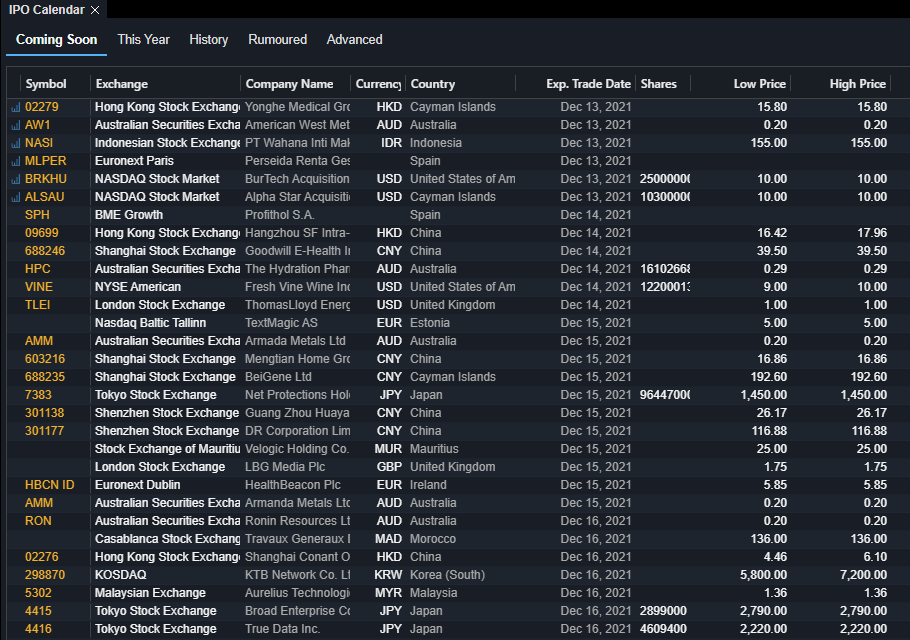
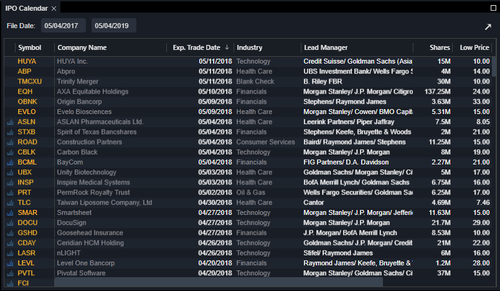
Improved IPO Calendar (1.8.2)
IP Oh yes we did.
We have improved on a classic with the latest release of the IPO calendar. Now with more data including international IPOs and Rumors.
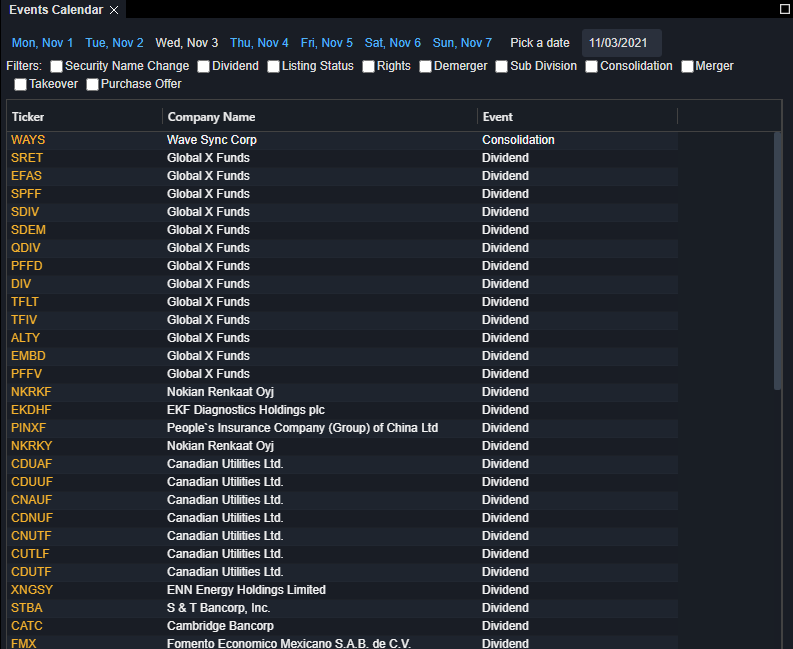
Events Calendar (1.8)
Cal me, Maybe?
Too much information in the Corporate Actions component? Events Calendar can help you with that. Use it to get a quick view of what's happening in the current business week.
Custom Watchlists and Templates in Market Map (1.7.7)
Because your watch, your watch, is on my list
Now you can access all of your favorite custom watchlists and our pre-made watchlist templates in the market map component. This should help with a broader overview of your stocks.

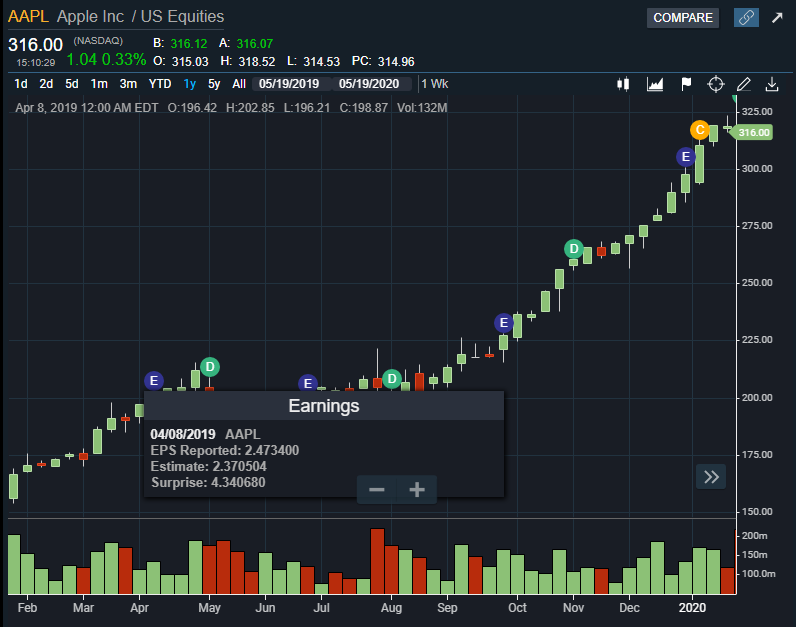
Corporate Events in Charts (1.7.7)
Want to get a visual on when a particular company has earnings or a corporate event? Just click on the flag in the upper right near the studies to add events to your charts.
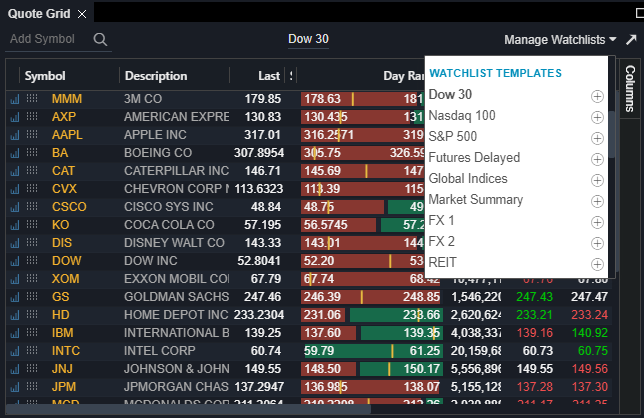
Watchlist Templates (v1.7.4)
Don't Believe Me? Just Watch.
Too busy to build out a full quote grid of tickers? We've got you covered. Now, in your watchlists you will have templates available for viewing as is, or you can customize them from an easy starting point. Just select the name to view, or click the ⊕ to start editing it to make it your very own.
Government Yield Curve (v1.5)
When I governsaid it, I government it.
With the Government Yield Curve component, you now have the ability to plot the yields for bonds of various maturities. The curves of 20+ countries are available in both color-coded chart form as well as a detailed table.

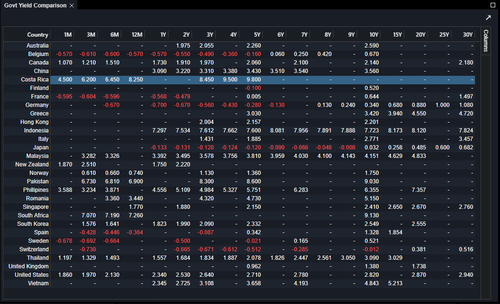
Government Yield Comparison (v1.5)
Nothing compares to you.
The Government Yield Comparison is an easy to digest table which allows you to compare the bond yields between multiple countries with similar maturity dates.
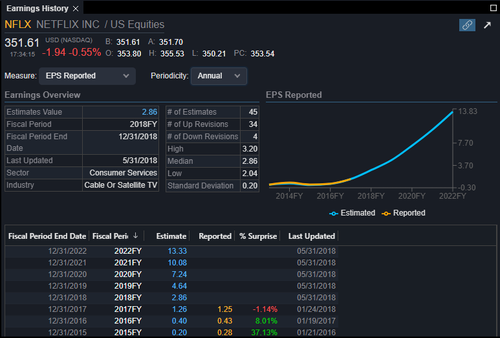
Earnings History (v1.4)
To everything earn, earn, earn.
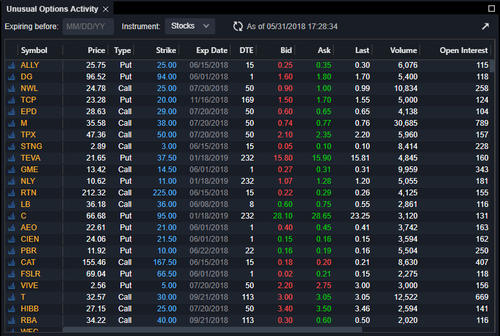
Unusual Option Activity (v1.4)
It's not unusual.
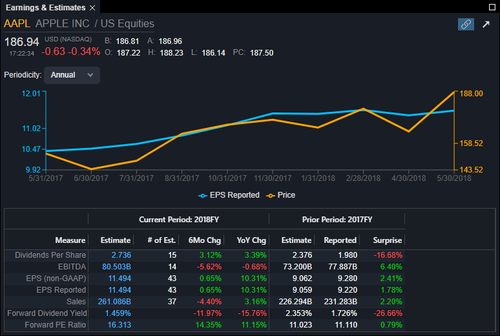
Earnings and Estimates (v1.4)
G'day, estimates.
Earnings and Estimates has now graduated to its own component with easier to understand display, and several new forward-looking data points. EBITDA, EPS, Sales, it's all here.
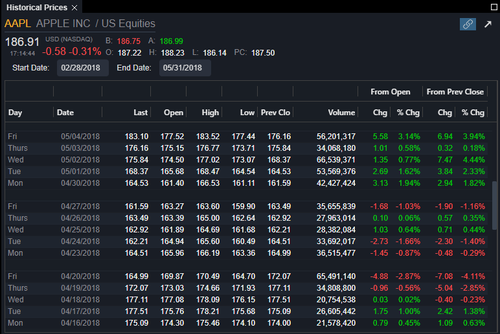
Historical Prices (v1.4)
Later, gator.
Now you can view historical prices in an easy to digest format that isn't via Charts or Excel. Just enter a symbol and a date range and go.
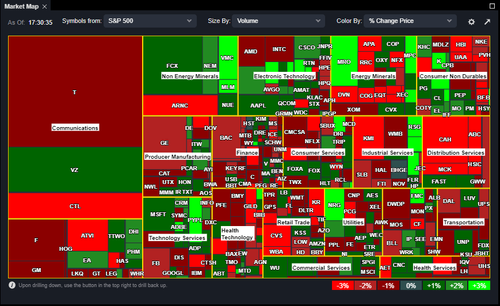
Market Heat Map (v1.3)
He's heating up.
Another classic has been revamped for your viewing pleasure. The Market Map is one of the fastest ways to get a macro view of the major indices during the trading day. Find it in the Components menu.
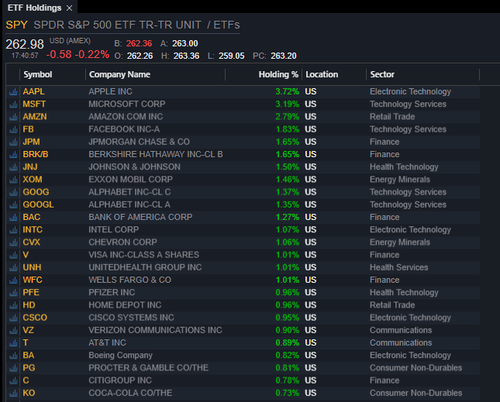
ETF Holdings (v1.3)
You gotta know when to hold 'em.
Using the ETF holdings component you can quickly find and sort through the composition of popular U.S. ETFs.
IPO Calendar
Publicly Speaking.
The IPO calendar is growing up. Now separated from the Equity Calendar, it has even more relevant data and updates more often.
Currency Quote Grid
20th Century FX.
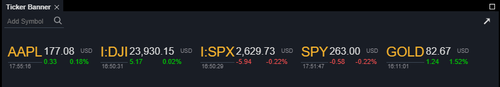
Ticker Banner (v.1.3)
Hickory Tickery Tock.
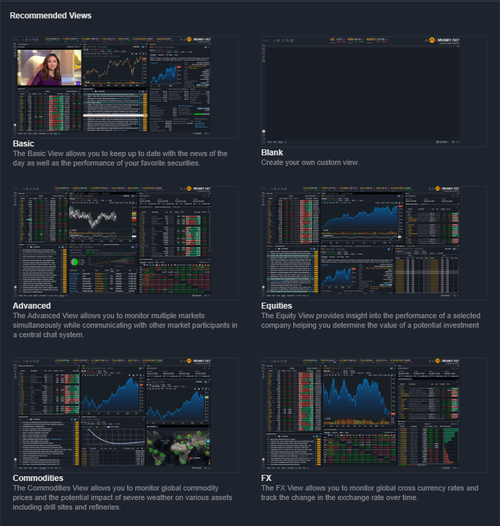
Recommended Views (v1.2.1)
Take it from us.
Don't feel like creating a view from scratch or starting with our default view? Try starting with one of the recommended views tailored to different trading styles and abilities.
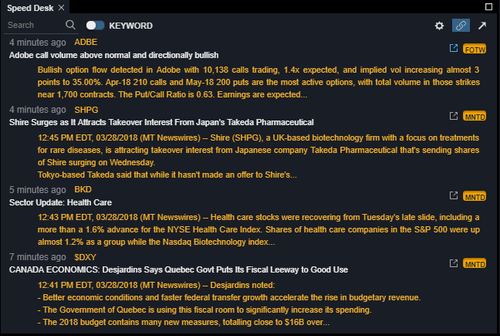
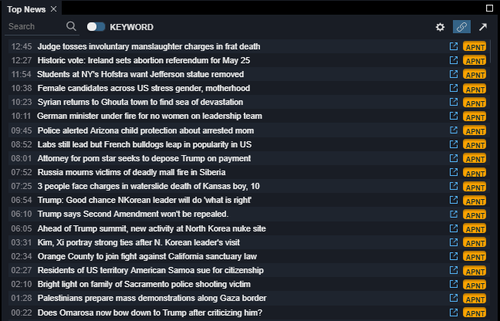
Expanded News Capability (v1.2.1)
The Streaming News component gives you access to the full pipe of headlines all day, but sometimes that can be too much. We have added the Speed Desk (for major market news) and Top News (for broad news targeted to specialties and sectors) to help you get right to the news you want to see most.
The Streaming and Top News components, now also come equipped with individual settings to help filter your sources in a more granular way.
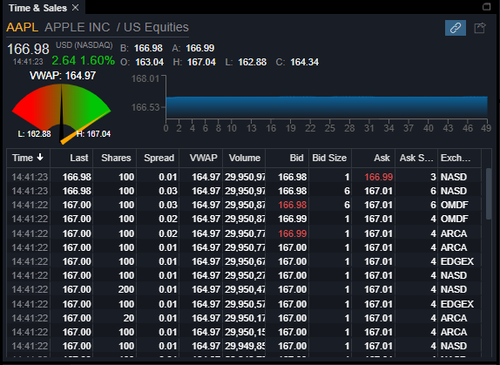
Time and Sales (v1.1.0)
Time is Money. Sales is Money.
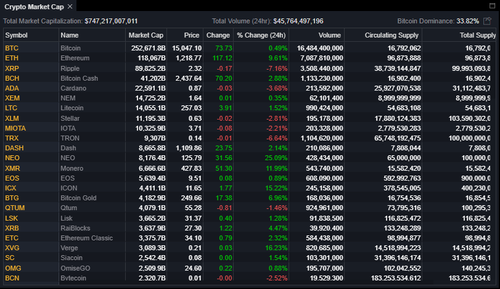
Cryptocurrencies and Crypto Market Cap (v1.0.1)
It's a new world out there and Money.Net is here to give you the advantage with realtime pricing for all of the hottest new alt coins and cryptocurrencies.
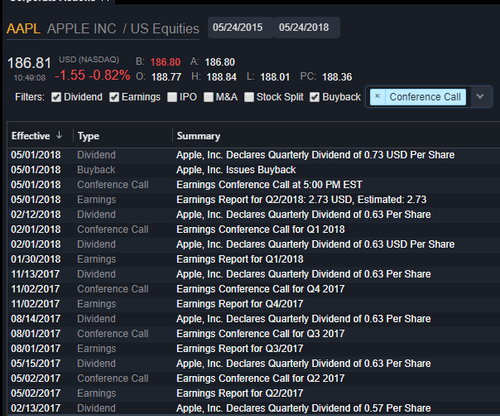
Corporate Actions Component (v1.0.1)
Corporate Lights. Corporate Camera.
A favorite from our previous platform, the Corporate Actions module helps you to stay in the know about happenings with the companies that you follow.