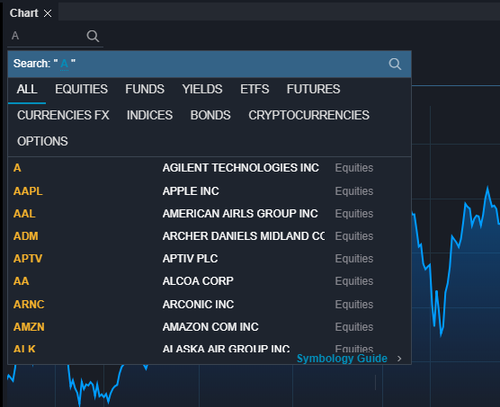
Entering a Ticker into the Chart Module
- Place the mouse pointer in the ticker Symbol field in the upper-left corner of the chart moduleChart component.
- Type the ticker symbol and press the Enter key to update the chart data.
- Be sure to refer to the Money.Net Ticker Symbology Guide to learn how to construct
tickers for all asset classes. - See image to the right.
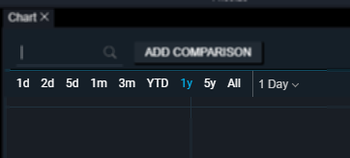
Selecting a Chart Time
and DurationInterval
- Directly below the ticker fieldchart price data, the chart time and duration interval can be selected.
- Historical data sets range from realtime intra-day ticks to daily charts up to 20 plus years.
- See image to the right.
Using the Chart Tools
- Studies Select 1day, 2day, 5day, 1month, 3month, year-to-date, 1year or All.
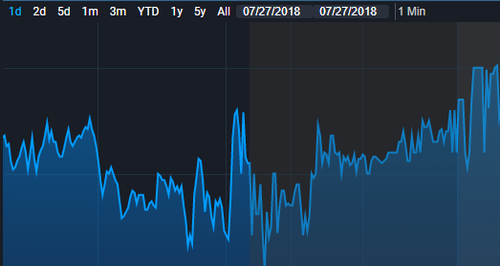
Selecting a Chart Periodicity Interval
- To the right of the chart time interval, the chart periodicity interval can be selected.
- Click the chart periodicity interval to expose the alternate intervals.
- Available periodicity intervals can vary due to the chart time interval that is currently selected.
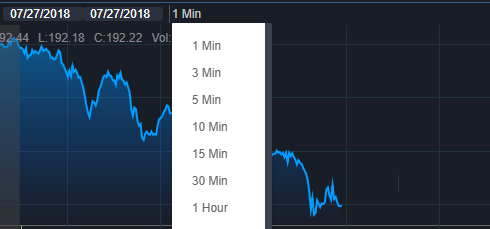
Chart Studies
Studies - a list of over 70 technical indicators that can be added to charts such as:
MACD, Stochastics, Bollinger Bands, VWAP, etc.
Display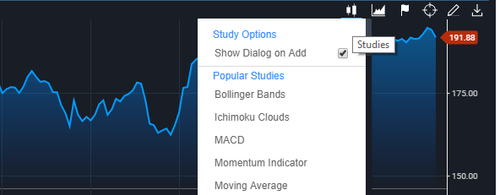
Chart Type
Chart Type - allows the user to select their preferred chart type such as:
Bar charts, Candle charts, Line Charts, Renko Charts, etc.
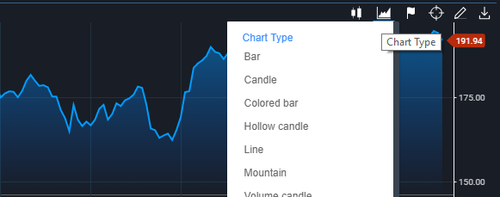
Chart Events
Events - plot a multitude of Corporate Events onto a chart such as:
Earnings, CEO change, Spin-offs, Dividends, etc.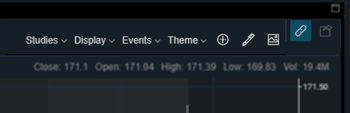
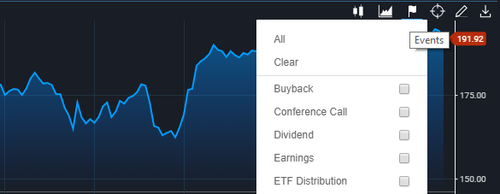
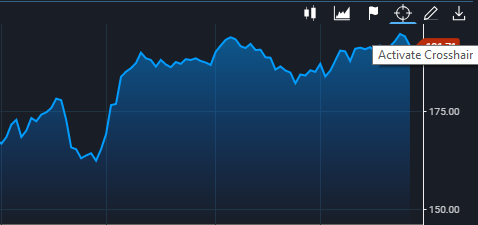
Chart Crosshair
Activate the chart crosshair to easily view open, high, low, close
price data for a specific chart interval point.