| Table of Contents | ||
|---|---|---|
|
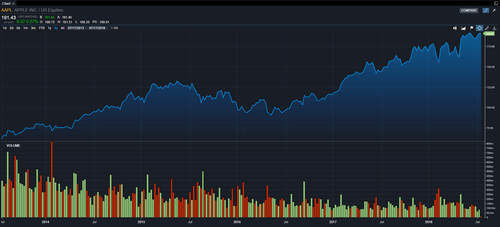
The Chart component is a professional-grade charting package that is both intuitive and powerful. It can provide live real time ticks or 20 years of historical data with just the click of a button. It also includes a variety of tools such as:
- Over 70 Technical Study Indicators
- Corporate Events
Bar, Line, Area, Candle Graphs, and more
- Export to PNG
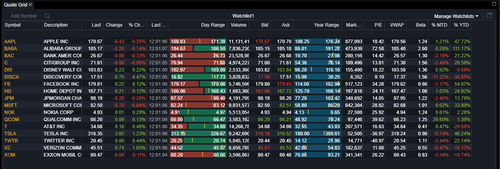
Watchlist allows you to maintain up to 25 watchlists to view streaming real time market data. In this component, you can sort, order, add/remove and arrange the data to your preference.
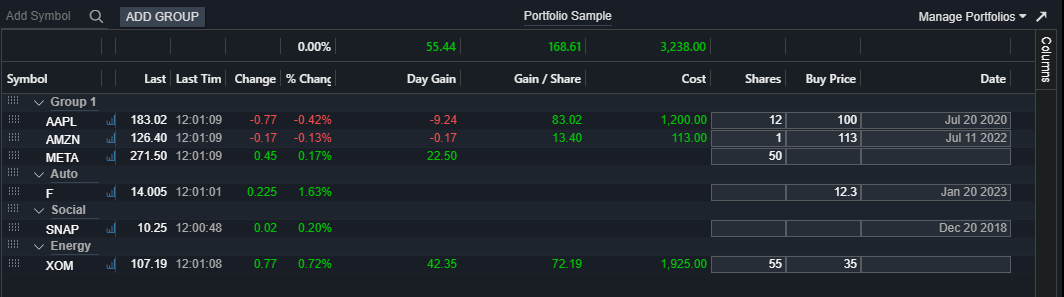
The Portfolio Monitor allows you to maintain up to 25 portfolios to view streaming real time market data and monitor your holdings and totals.
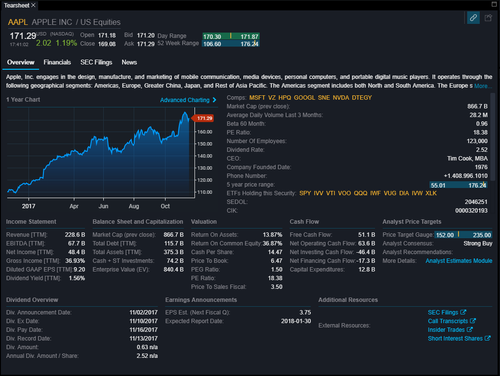
The Tearsheet is a one stop institutional grade summary snapshot. It is an efficient way to display a wide range of data such as:
- Realtime price data
- Company financials and fundamentals
- Historical charting
- Relevant news
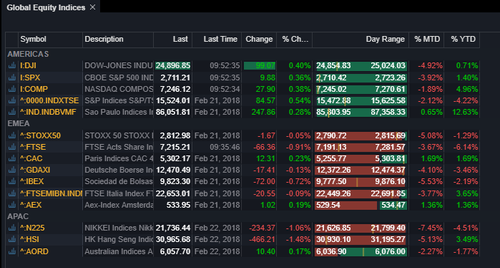
Global Equity Indices component is an overview of some of the major indices in the U.S. and abroad.
The Snap Quote component is a fast overview component that will allow you to check some popular fields and see a time and sales tape of the most recent trades.
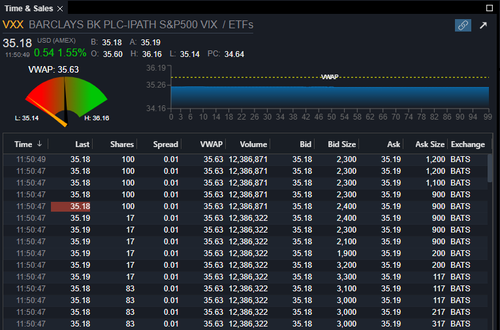
See the streaming tape of a particular stock as it trades in real time with the Time and Sales module.
Ticker Banner is additional space to add large indices (or any symbol you want to watch) in supplement to your upper banner area.
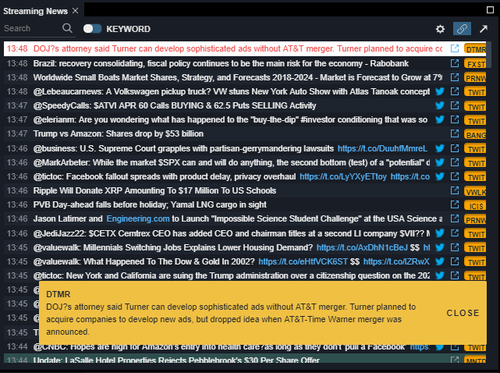
The Streaming News component is our proprietary, algorithm, and hand-curated stream of news services brought to you in real time. You can follow market movement, major global news, and sort by companies or search terms that you choose.
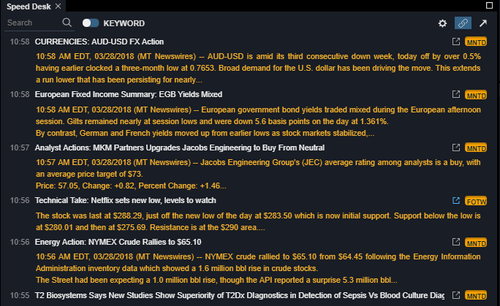
Speed Desk is a streamlined news component with only the major market-moving stories of the day.
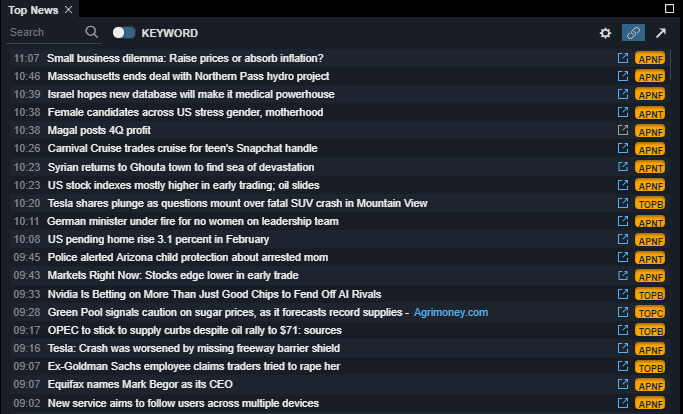
Top News is a news component specialized for seeing the most relevant stories in broad categories and industries.
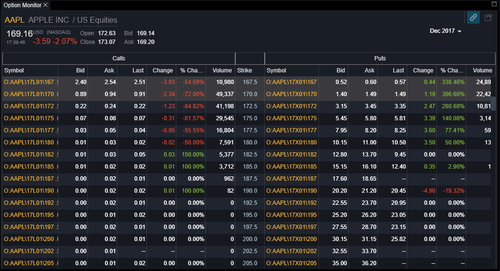
The Option Chain allows you to pull the real time option data for U.S. equities (requires OPRA exchange permission from CBOE™).
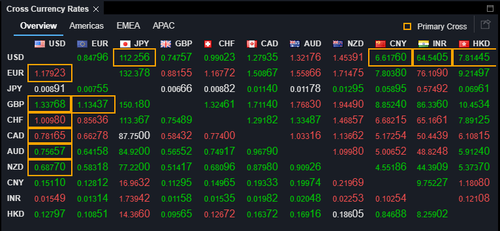
The Currency Quote Grid is useful for those looking for a straight ahead grid view vs. Cross Currency Rates or more off the beaten path currency pairs.
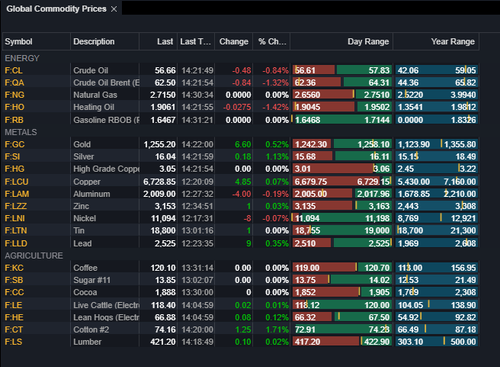
Global Commodity Prices gives you a quick overview of prices for major Energy, Metal, and Agricultural futures.
The Chart component is a professional-grade charting package that is both intuitive and powerful. Real time ticks or 20 years of historical data with just the click of a button. It also includes a variety of tools such as:
- Over 70 Technical Study Indicators
- Corporate Events
Bar, Line, Area, Candle Graphs, and more
- Export to PNG
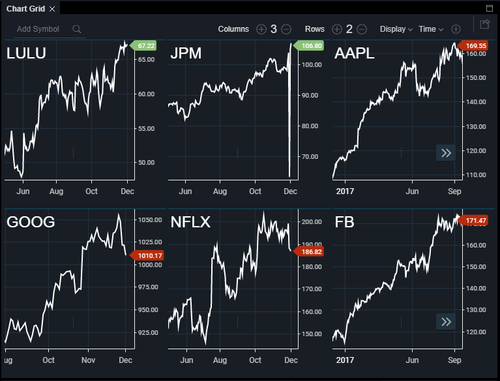
The chart grid is the best way to chart multiple assets quickly and simply without deploying multiple /wiki/spaces/techsupport/pages/37650457 components.
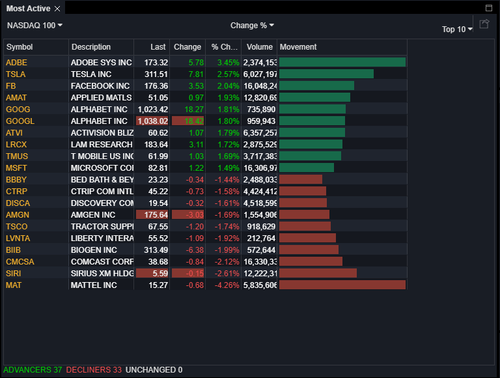
Most Active allows you to view the top 10,25, or 50 movers on the day in any of your watchlists.
Use Market Heat Map to get a macro view of the day's market divided into sectors that can be drilled down into. You can choose from the major indices, watchlist templates, or your own custom watchlists created in Watchlist.

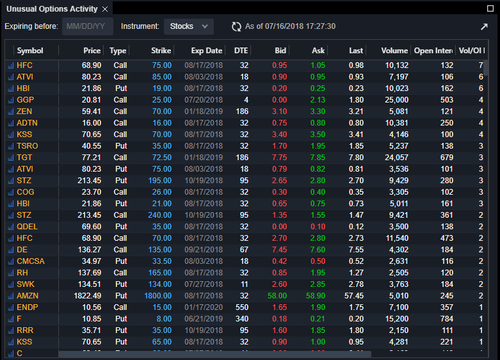
With the Unusual Option Activity component, you can be the first to know when there is unusually high volume for any U.S. option contracts and sort by the pertinent info.

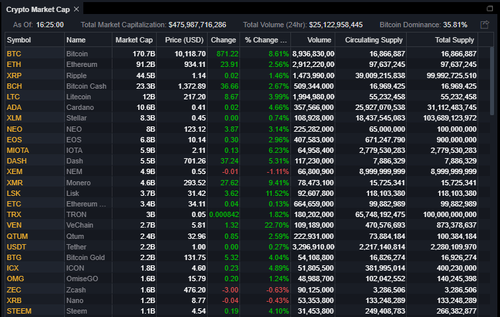
Crypto Market Cap
The Tearsheet is a one stop institutional grade summary snapshot. It is an efficient way to display a wide range of data such as:
- Realtime price data
- Company financials and fundamentals
- Historical charting
- Relevant news
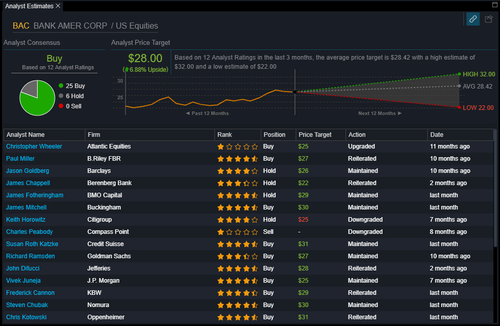
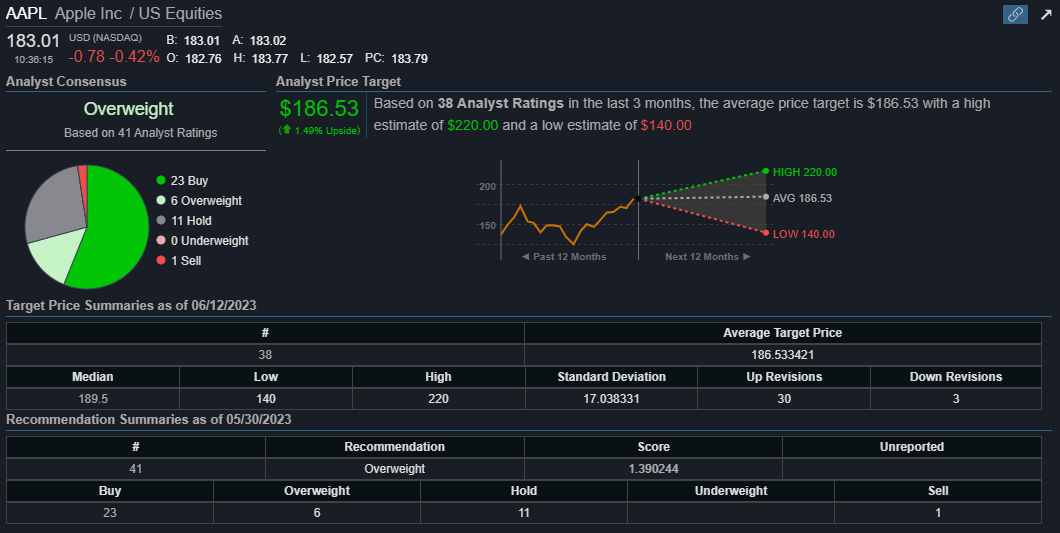
Analyst Recommendations
With Analyst Recommendations you can view average price targets and consensus Buybuy/Sell sell recommendations from TipRanks™.
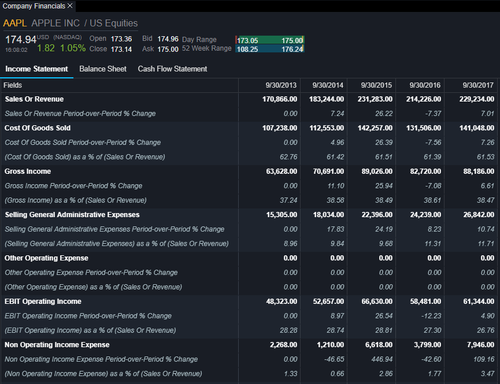
The Company Financials component is an easy to digest representation of the Income Statement, Balance Sheet, and Cash Flow of publicly traded U.S. companies. Note that these are also available on the Tearsheet.
The Corporate Actions component allows you to view various announced and historical corporate actions for an equity.

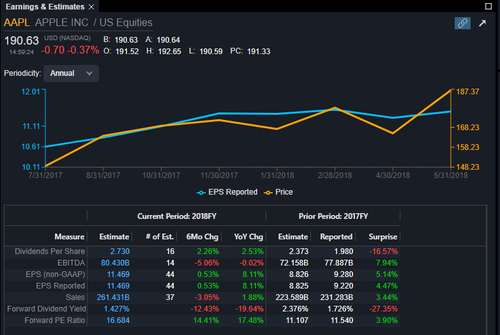
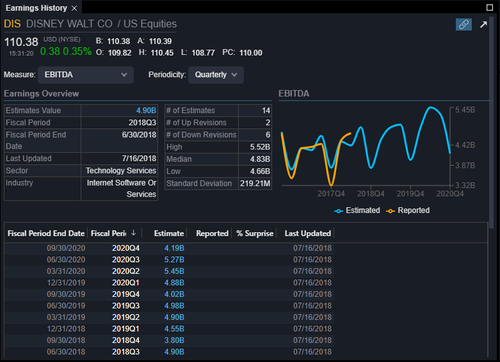
With this component, you can find the quarterly and annual earnings estimates, actual reported estimates and surprise numbers for U.S. equities.
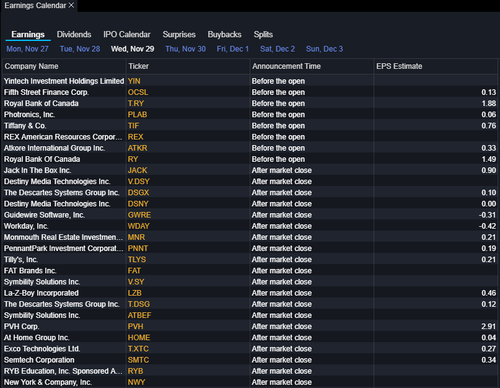
Earnings Calendar
Earnings Calendar is an overview of the week's earnings events.
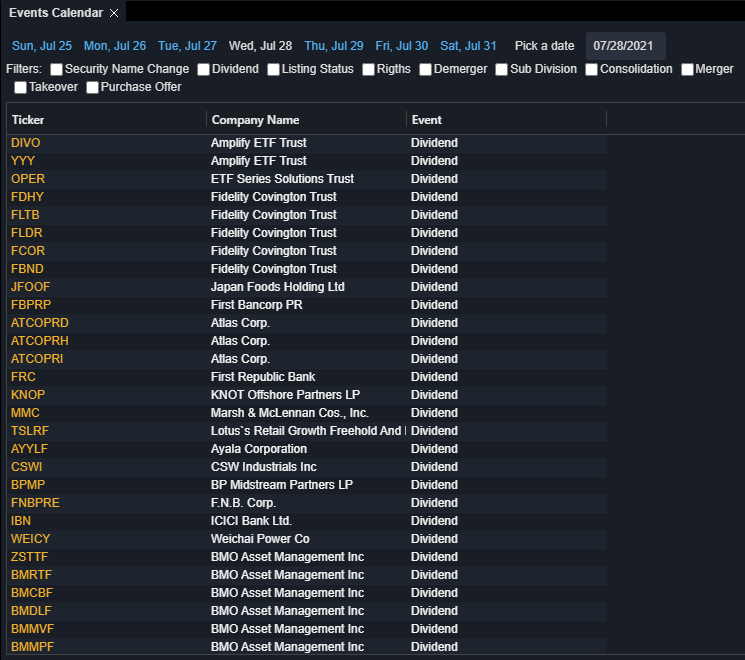
Events Calendar
Events Calendar is an overview of the week's corporate events.
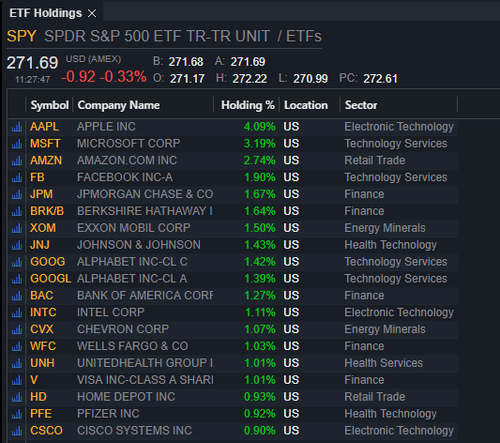
You can dig into the composition and weighting of U.S. ETFs using the ETF Holdings component.
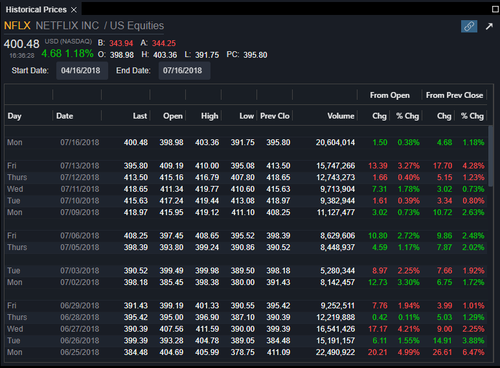
Historical Prices
The Global Equity Indices component is an overview of some of the major indices in the U.S. and abroad.
Market Map
Use Market Map to get a macro view of the day's market divided into sectors that can be drilled down into.
The Option Monitor allows you to pull the real time option data for U.S. equities (requires OPRA exchange permission from CBOE™) and futures on several exchanges.
Time and Sales
See the streaming tape of a particular stock as it trades in real time with the Time and Sales module.
Unusual Options Activity
Crypto Market Cap
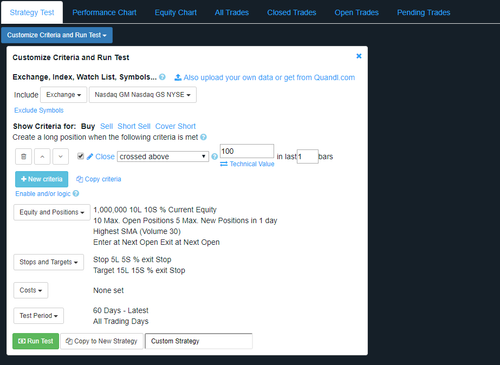
Back Testing
Using the Back Testing component you can test simple or complex trading strategies against a large repository of historical market data.
The chart grid is the best way to chart multiple assets quickly and simply without deploying multiple /wiki/spaces/techsupport/pages/37650457 components.
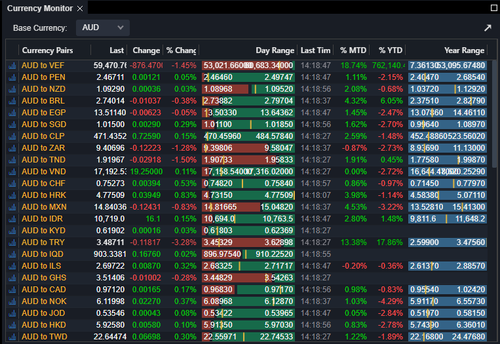
The Currency Monitor is useful for those looking for a straight ahead grid view vs. Cross Currency Rates or more off the beaten path currency pairs.
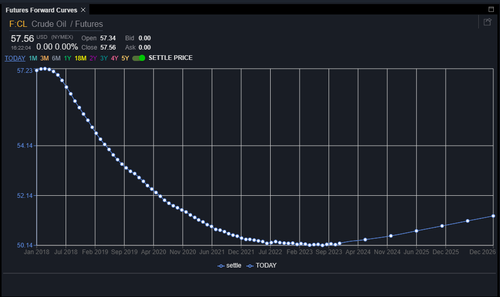
Futures Forward Curves
The Futures Forward Curve defines the prices at which a contract for future delivery or payment can be concluded today.
Global Commodity Prices
Global Commodity Prices gives you a quick overview of prices for major Energy, Metal, and Agricultural futures.
Most Active allows you to view the top 10,25, or 50 movers on the day in any of your watchlists or portfolios.
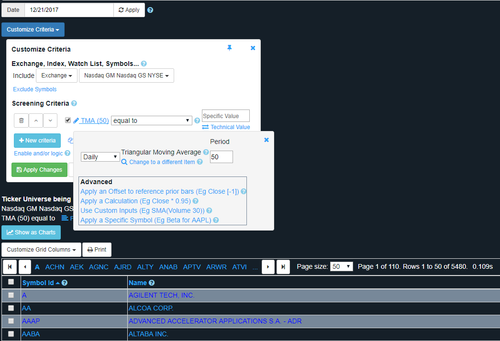
Screening
Find the company or instrument that you are looking for with our in-depth and flexible stock screening utility. Screen on technicals, fundamentals, and more.
The Snap Quote component is a fast overview component that will allow you to check some popular fields and see a time and sales tape of the most recent trades.
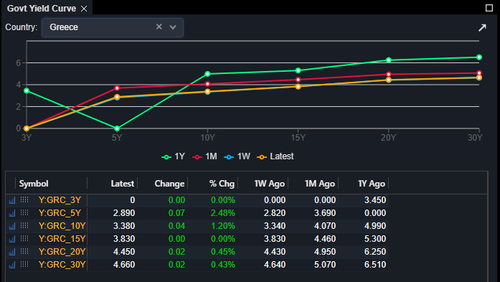
Government Yield Curve
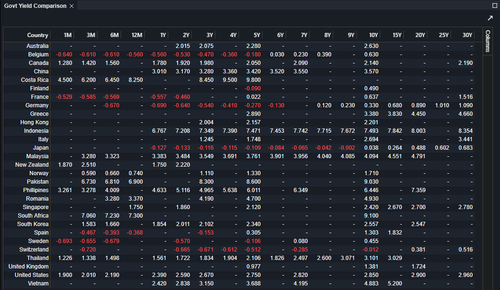
Government Yield Comparison
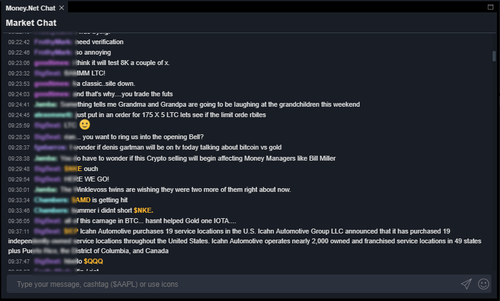
Engage in the one of a kind Money.Net member community with the Chat component. Share stock ideas, news of the day, or what you plan to eat for dinner. And did someone say emoji? ![]()
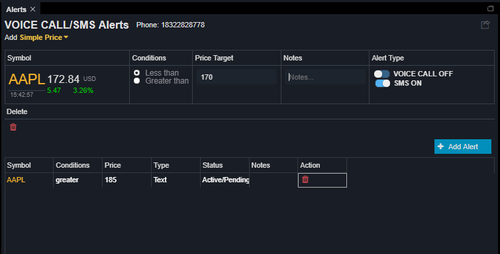
Alerts
Speed News Desk is a streamlined news component with only the major market-moving stories of the day.
Top News is a news component specialized for seeing the most relevant stories in broad categories and industries.
The Streaming News component is our proprietary, algorithm, and hand-curated stream of news services brought to you in real time. You can follow market movement, major global news, and sort by companies or search terms that you choose.
Earnings Calendar is an overview of the week's earnings events.
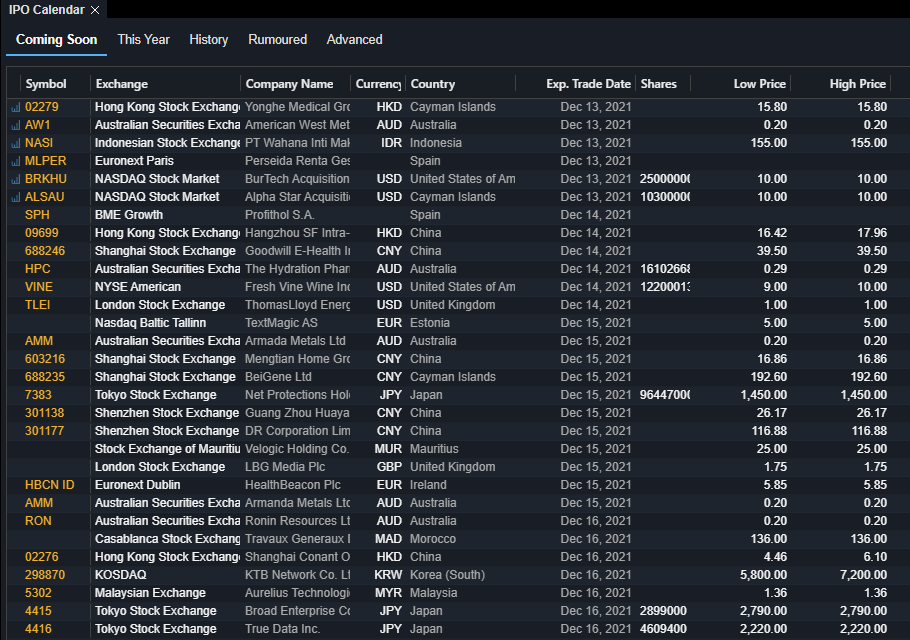
The IPO Calendar is your go-to source for any upcoming announcements, changes, pricing and more for companies planning to go public. We are proud to now also offer international (non-US) data.
Corporate Calendar is an overview of the week's corporate events.
Scout Chat
This component allows the self-directed investor to access a robust, collaborative community. Scout chat delivers secure, safe environments where users can interact, leverage signals to push relevant content their way and follow other investors that they find interesting.
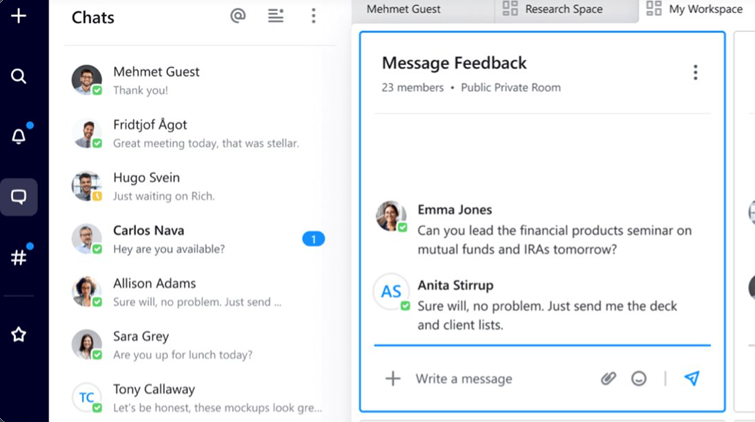
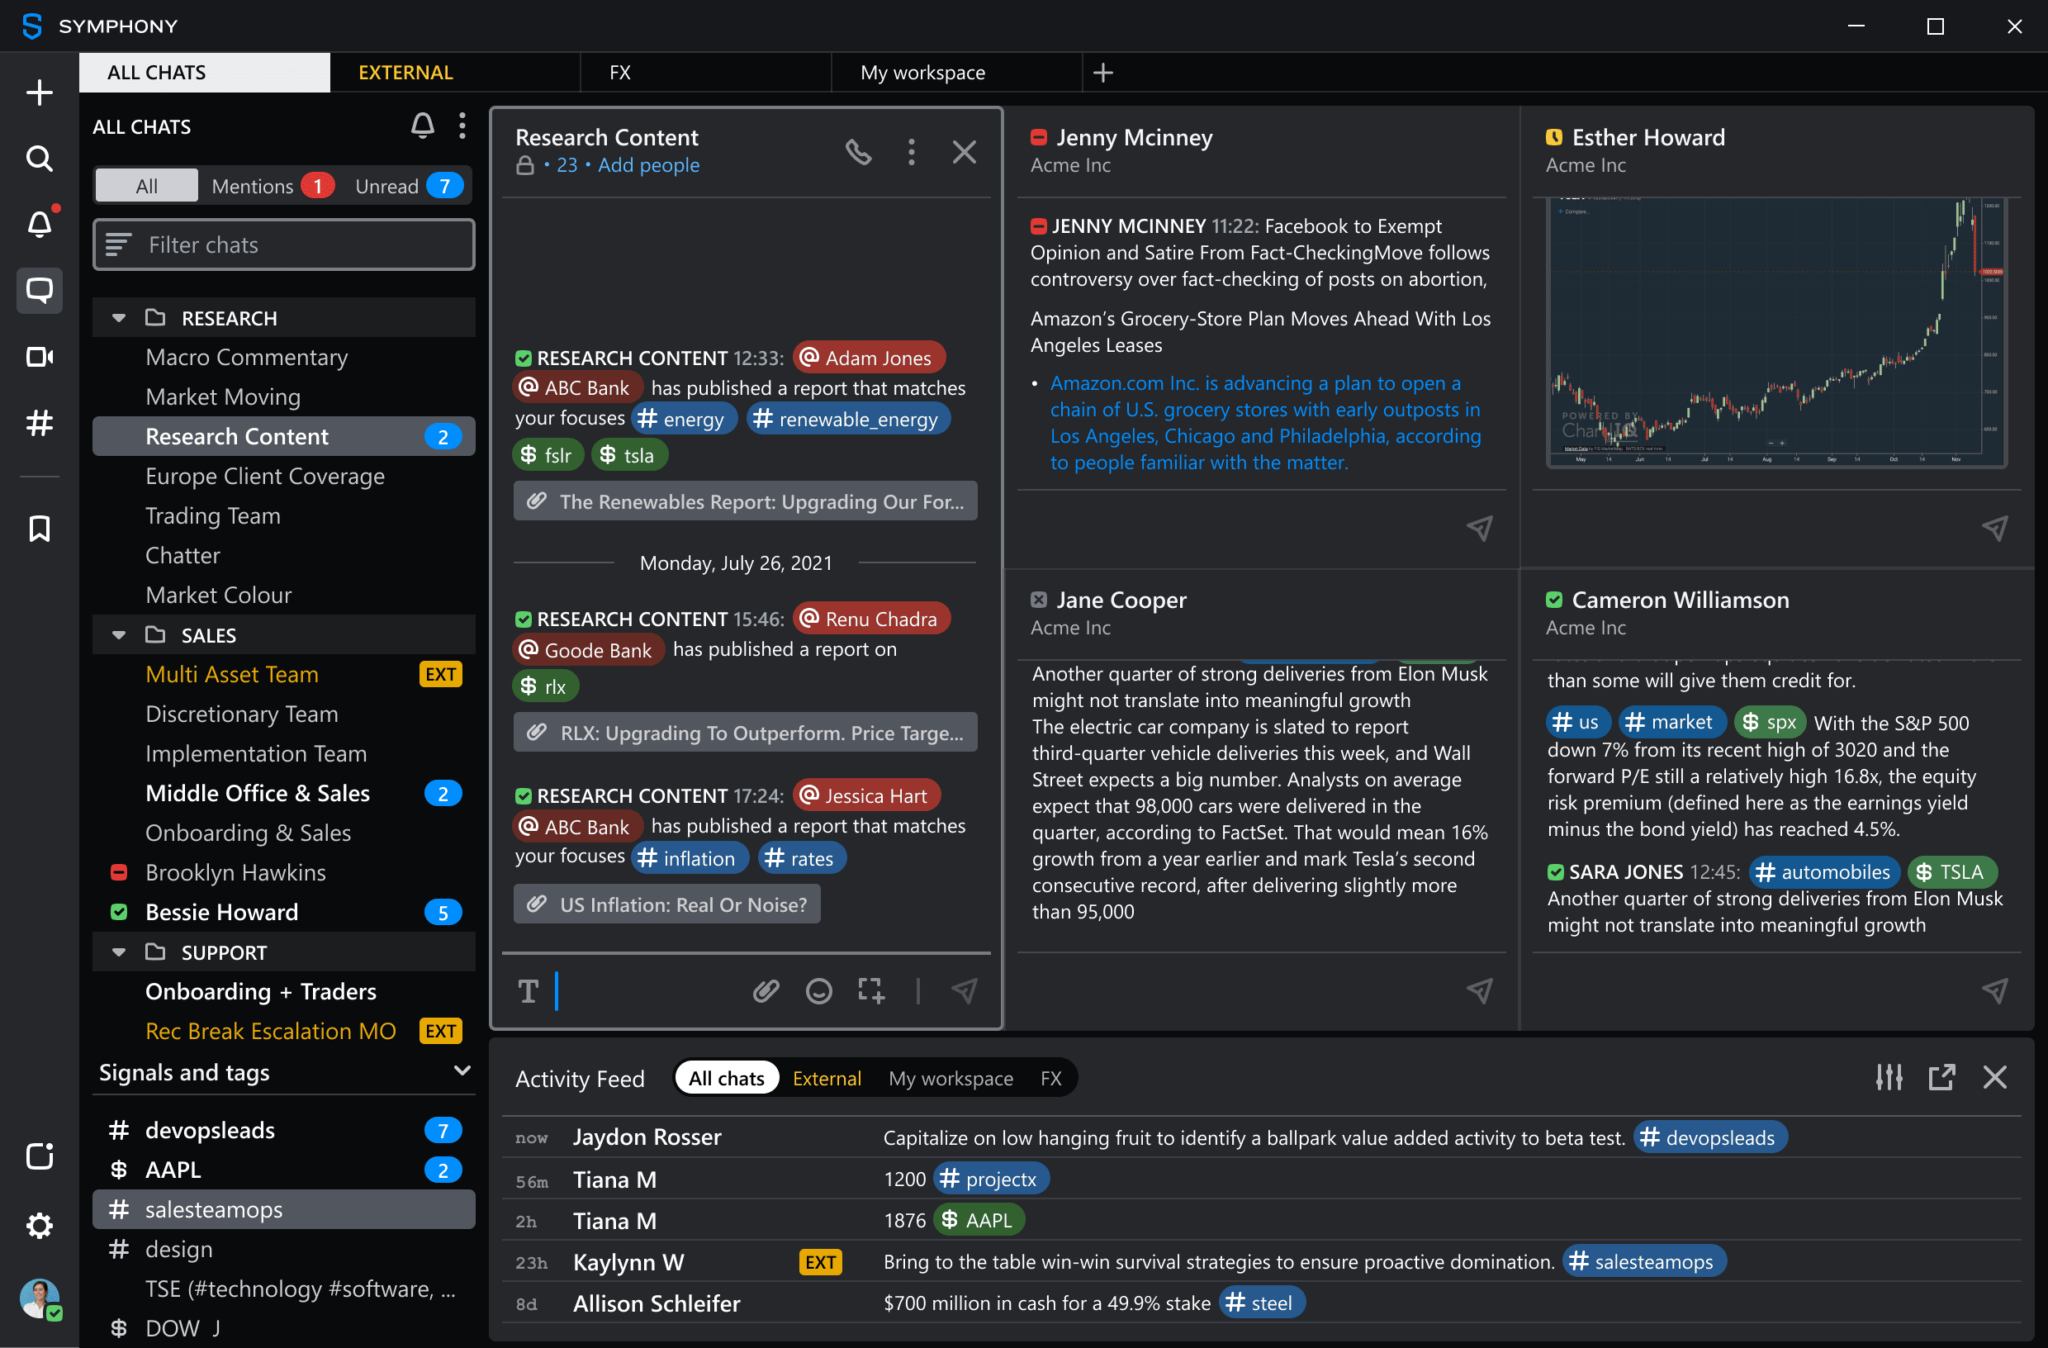
Symphony Chat
This component allows you to access your company's Symphony pod without having to change to another tab or leave the platform.
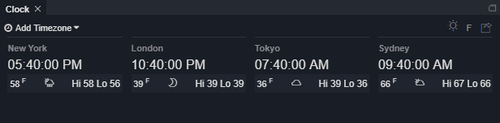
Clock
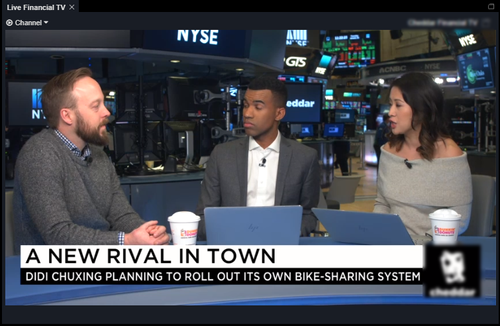
Live Financial TV
This component allows you watch live streaming financial TV (and listen to live radio/audio) right inside your platform.